Common Azure SQL Bottlenecks and Fixes
Azure SQL databases can face performance issues that slow down operations, frustrate users, and disrupt workflows. These issues typically fall into three categories:
- CPU-bound bottlenecks: High CPU usage caused by missing indexes, outdated statistics, or parameter sniffing.
- Resource-bound bottlenecks: Delays due to disk I/O, memory, or locking issues.
- Application design flaws: Inefficient queries, frequent network calls, or poor caching.
To resolve these problems, Azure SQL provides tools like Query Store, Database Advisor, and Automatic Tuning. These help identify and fix common issues such as missing indexes, parameter sniffing, blocking, tempdb contention, and I/O bottlenecks. Solutions include optimizing queries, creating indexes, adjusting isolation levels, and upgrading service tiers. Monitoring tools like Azure SQL Insights offer database-wide performance insights to maintain smooth operations.
Introduction to Performance Troubleshooting [1 of 7] | Azure SQL for beginners
sbb-itb-79ce429
Common Azure SQL Bottlenecks and How to Fix Them
Azure SQL Database Bottlenecks: Identification Methods and Key Metrics
Azure SQL performance issues often stem from specific bottlenecks. Below are common problems, how to identify them, and practical fixes to get your database running smoothly.
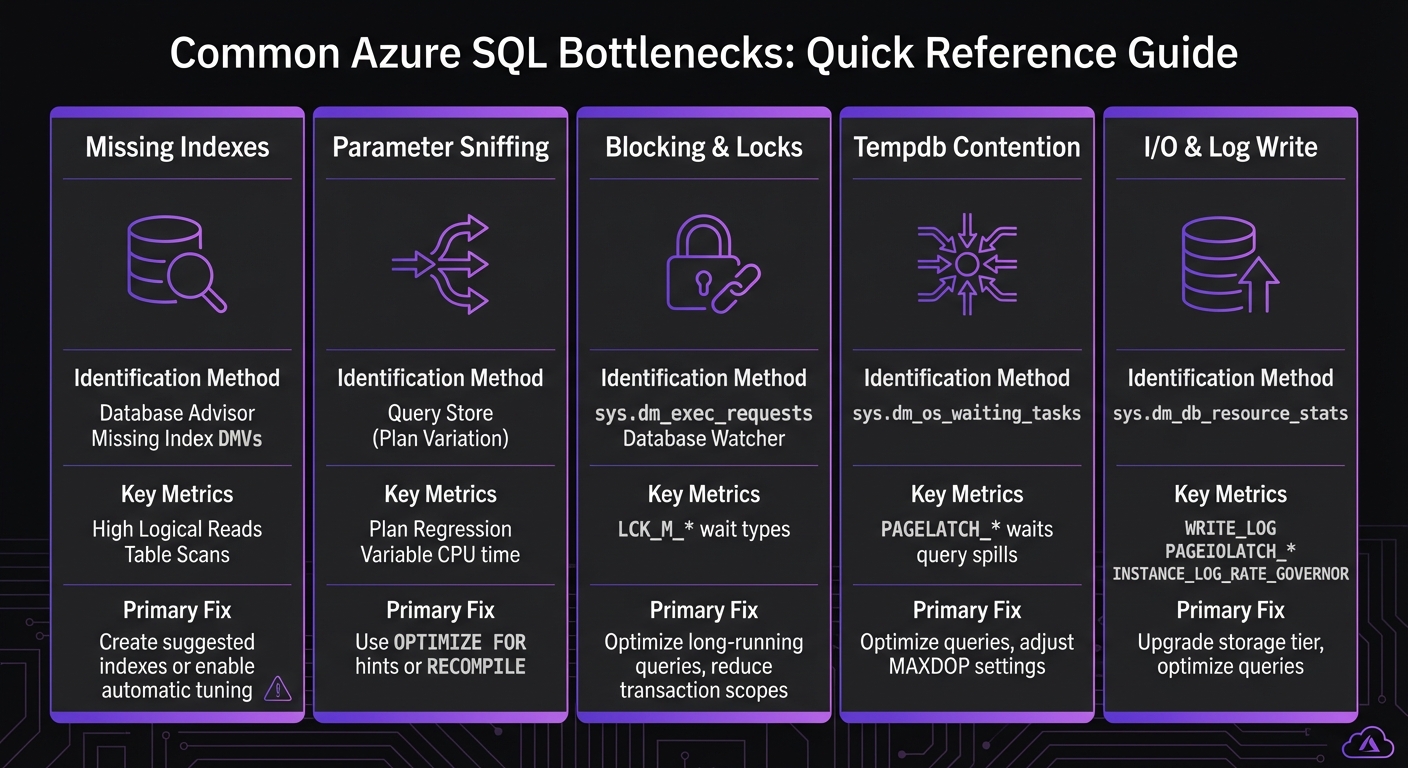
Missing Indexes
When the database lacks the right index, it resorts to table scans or key lookups, forcing it to read more data than necessary. This often shows up as high logical reads in query metrics, slowing down response times.
To spot this issue, use Database Advisor and Missing Index DMVs, which highlight queries consuming excessive CPU and generating high logical reads. The solution? Create the suggested indexes or enable automatic tuning to let Azure manage index creation for you. Just be cautious - adding too many indexes can slow down write operations.
Parameter Sniffing
This happens when SQL Server reuses an execution plan based on the first parameter it encounters, even if a different parameter would benefit from another plan. The result? Some queries run smoothly, while others drag.
You can diagnose this using Query Store, which tracks plan variations and highlights inconsistencies. Fix it by using OPTIMIZE FOR hints or RECOMPILE to ensure the query uses the most efficient plan for each parameter.
Blocking and Locks
Blocking occurs when one query locks data that another query needs, causing delays. This often appears as LCK_M_* wait types in monitoring tools. Long-running queries are usually the root cause, as they hold locks longer than necessary.
To identify blocking queries, check sys.dm_exec_requests or use Database Watcher. Solutions include optimizing long-running queries, reducing transaction scopes, or adjusting isolation levels. The Query Store can also help pinpoint problem queries that need optimization.
Tempdb Contention
When multiple threads compete for tempdb resources - due to query spills, temporary tables, or large sorting operations - PAGELATCH_* waits can occur, causing delays.
Monitor tempdb contention using sys.dm_os_waiting_tasks. To address this, optimize queries to reduce spills by adding indexes or rewriting them, adjust MAXDOP settings to limit parallelism, and avoid unnecessary use of temporary tables or large sort operations.
I/O and Log Write Bottlenecks
I/O bottlenecks often show up as WRITE_LOG or PAGEIOLATCH_* waits. These are common in transaction-heavy workloads where the transaction log becomes a bottleneck or when queries require heavy disk reads.
Detect these issues with sys.dm_db_resource_stats and INSTANCE_LOG_RATE_GOVERNOR. Fixes include upgrading your storage tier, tuning configurations, or optimizing queries to reduce I/O demands.
| Bottleneck | Primary Identification Method | Key Wait Types / Metrics |
|---|---|---|
| Missing Indexes | Database Advisor, Missing Index DMVs | High Logical Reads, Table Scans |
| Parameter Sniffing | Query Store (Plan Variation) | Plan Regression, Variable CPU time |
| Blocking & Locks | sys.dm_exec_requests, Database Watcher |
LCK_M_* |
| Tempdb Contention | sys.dm_os_waiting_tasks |
PAGELATCH_* (on tempdb), spills |
| I/O & Log Write | sys.dm_db_resource_stats |
WRITE_LOG, PAGEIOLATCH_*, INSTANCE_LOG_RATE_GOVERNOR |
Advanced Optimization Techniques
After addressing common bottlenecks, advanced techniques can fine-tune query execution and improve memory management.
Memory Grant Waits
Memory grant waits occur when queries request more memory than the database can immediately provide. This often happens with operations like large sorts, hash joins, or complex aggregations. When multiple queries compete for limited memory, some are forced to wait, slowing down overall performance.
The Query Store is a key tool here. It tracks historical memory usage using the avg_query_max_used_memory metric, measured in 8 KB pages [1]. Pay attention to queries with significant variability in memory grants - this often signals inconsistent performance that needs addressing.
To tackle memory grant issues, start by rewriting queries to lower their memory demands. For example, adding WHERE clauses can help reduce the dataset size early in the process, minimizing the rows involved in sorting or joining operations [2]. If query optimization doesn't fully resolve the issue, you might need to increase your service tier to add more physical memory to the database [2]. Additionally, Intelligent Insights can identify "Memory Pile-up" patterns, where worker threads request memory faster than it can be released [2].
Once memory issues are under control, optimizing execution plans can further boost performance.
Execution Plan Optimization
Execution plans dictate how SQL Server retrieves data, and a poorly optimized plan can drag down performance. Plan regression is a common problem, occurring when a previously efficient plan is replaced by a slower one due to schema changes or shifts in data [3][2].
The Query Store is invaluable for analyzing execution plans. It allows you to compare different plan IDs for the same query and force the "last known good" plan if regression occurs. Watch for excessive parallelism, indicated by waits like CXP or CXPACKET. Address this by fine-tuning MAXDOP settings [2]. For databases using Compatibility Level 160, enable Parameter Sensitive Plan (PSP) optimization. This feature creates multiple plans tailored to different parameter values, solving parameter sniffing issues at the engine level.
| Tool/Feature | Primary Use Case | Key Metric/Action |
|---|---|---|
| Query Store | Plan Analysis & Forcing | Compare plan IDs and force "last known good" plans |
| Database Watcher | Real-time Monitoring | Detect workload increases and plan regressions |
| Intelligent Insights | Pattern Detection | Identifies memory pressure, locking, and MAXDOP issues |
DMV sys.dm_exec_requests |
Active Troubleshooting | Track cpu_time and wait_type for running queries |
Microsoft Tools and Services for Performance Tuning
Microsoft provides a suite of built-in tools designed to identify and resolve performance issues in Azure SQL databases. These tools work seamlessly to pinpoint bottlenecks and implement fixes, often without requiring manual intervention.
Using Query Store and Automatic Tuning
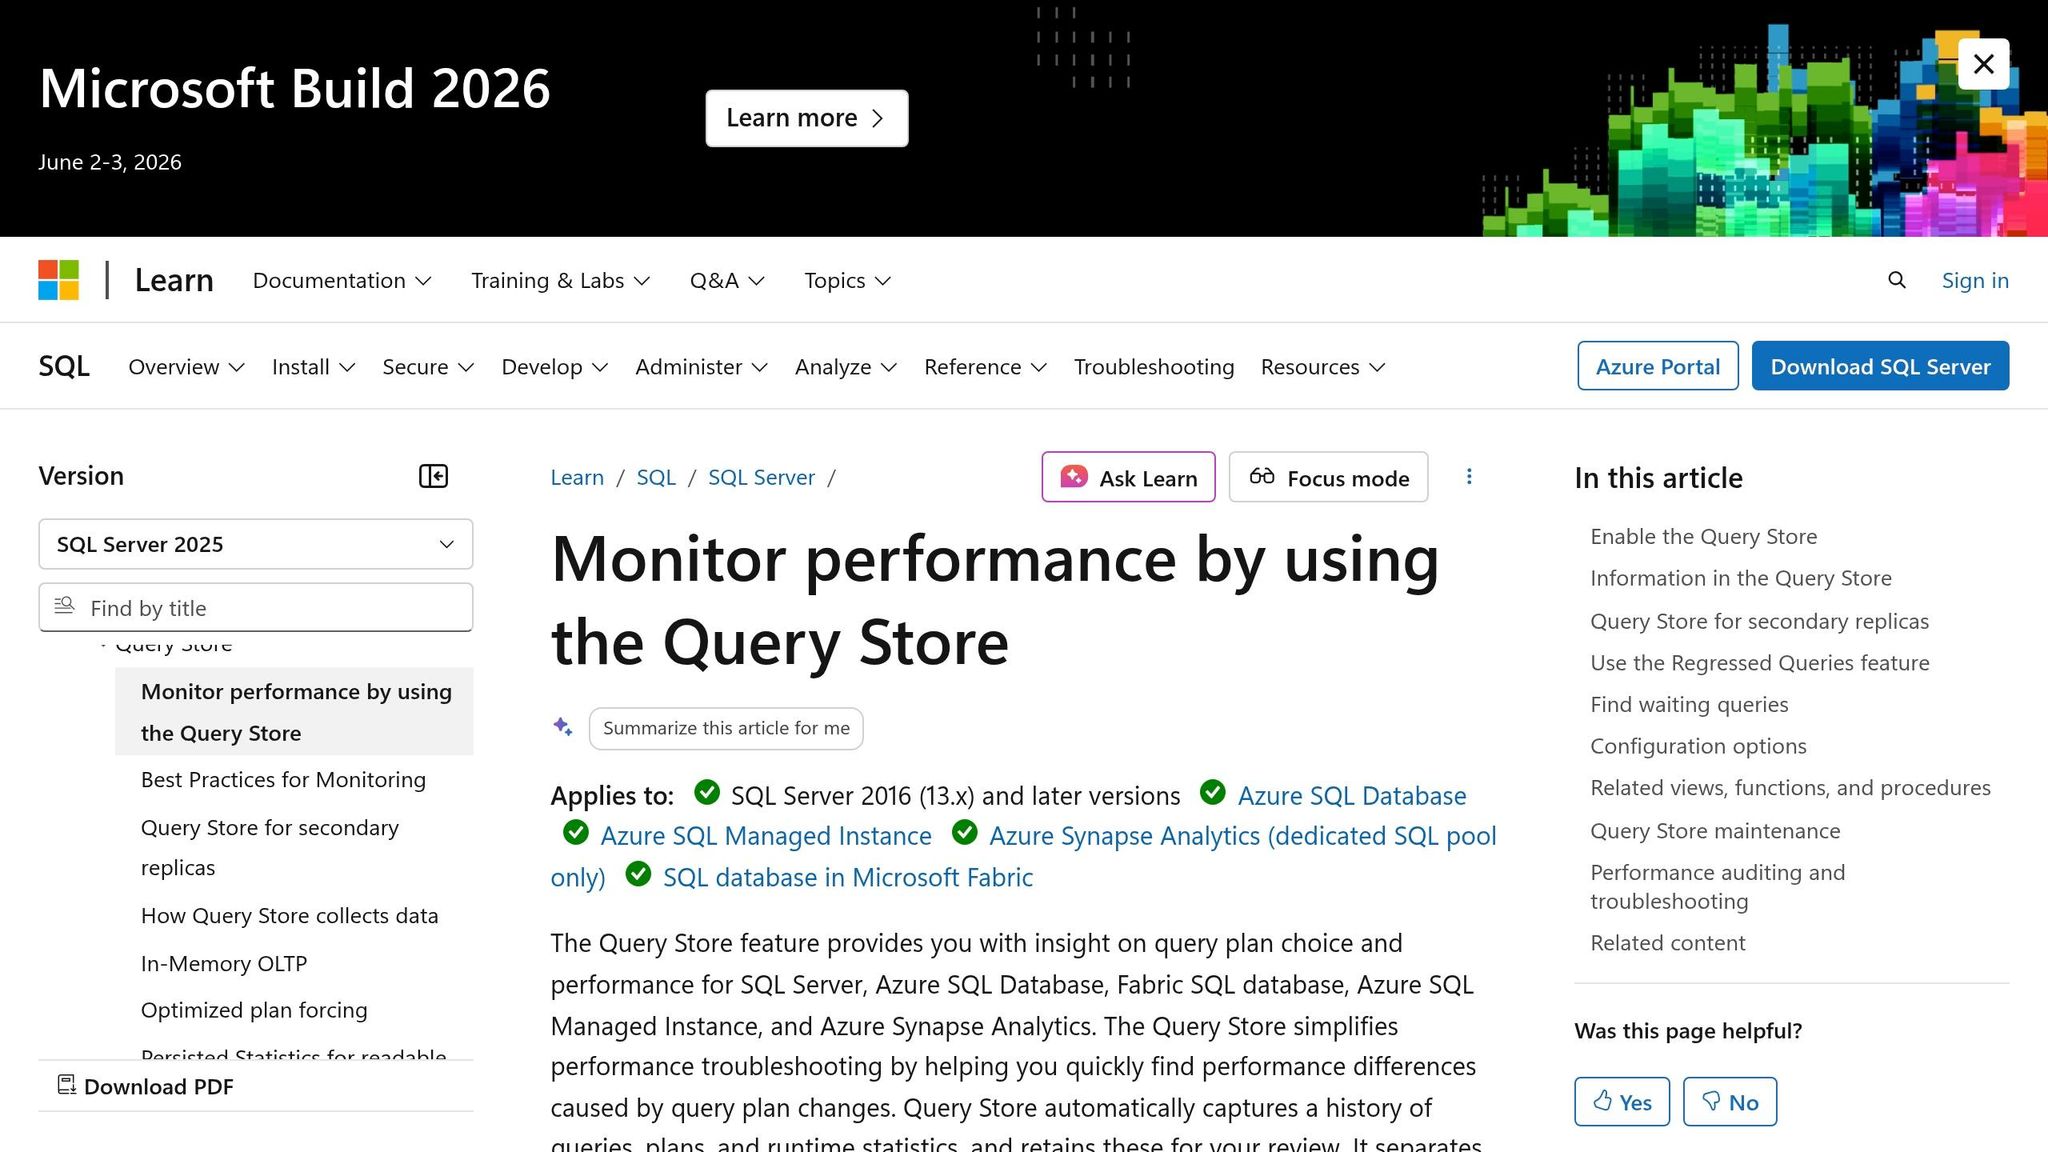
Query Store is a powerful feature that tracks a complete history of queries, execution plans, and runtime statistics. It captures key metrics like CPU usage, execution duration, frequency, and wait statistics. By maintaining this historical data, it helps uncover performance bottlenecks and regressions over time.
Building on this, Automatic Tuning uses Query Store data to apply fixes automatically. One standout feature, Force Last Good Plan, identifies when a query's execution plan has regressed and reverts to the previous, more efficient plan. This approach is particularly helpful in addressing issues like parameter sniffing and plan regressions. Additionally, Automatic Tuning handles index management by:
- Creating missing indexes.
- Dropping duplicate indexes.
- Removing unused indexes that haven't been accessed for over 90 days.
Every automated change undergoes a validation period, where performance is compared to a baseline. If the change negatively impacts performance, the system promptly reverts it. To leverage these tools effectively, enable Force Last Good Plan for most workloads and configure automatic tuning at the server level. This ensures all databases inherit the optimized settings. Use SQL Server Management Studio (SSMS) to review "Top Resource Consuming Queries" and analyze wait statistics via the sys.query_store_wait_stats view. This helps identify specific bottlenecks, such as issues with locking, I/O, or memory.
For a broader perspective, Azure SQL Insights complements these tools by providing high-level performance monitoring.
Monitoring with Azure SQL Insights
Azure SQL Insights, combined with Intelligent Insights, shifts the focus to database-wide performance trends rather than individual queries. While Query Store excels in tracking execution plan issues and parameter-sensitive plans, Azure SQL Insights identifies larger patterns like resource constraints, TempDB contention, and workload spikes. It uses telemetry and resource logs to deliver insights, automated alerts, and descriptions of performance patterns. These features can signal when scaling resources or making architectural changes might be necessary, offering a valuable complement to the detailed query-level data provided by Query Store.
Together, these tools deliver a comprehensive approach to managing and optimizing Azure SQL database performance.
Case Studies and Applications
Applying these tuning techniques in real-world scenarios delivers clear, measurable improvements to essential business systems. Here are a couple of examples that highlight the real impact of performance tuning.
Healthcare: Streamlining Scheduling Platforms
A healthcare scheduling platform managing over 250,000 appointments struggled with performance issues during peak hours. The root cause? Excessive small database calls that led to high network latency. To tackle this, AppStream Studio implemented several changes:
- Batched queries to minimize database round trips.
- Introduced stored procedures for efficiency.
- Added missing indexes on critical fields like appointment dates and provider IDs.
These adjustments significantly improved response times, ensuring the platform could handle heavy traffic without breaking a sweat.
Financial Services: Enhancing Medicare Reimbursement Scoring
A Medicare reimbursement scoring engine was plagued by inconsistent performance. The culprit turned out to be parameter sniffing, where execution plans optimized for simple cases faltered with more complex queries. AppStream Studio stepped in with targeted solutions:
- Fine-tuned query execution plans to handle diverse scenarios.
- Resolved contention issues in temporary databases.
The result? Consistently better performance, enabling faster and more reliable decisions on Medicare reimbursement eligibility.
These examples demonstrate how AppStream Studio's precise database tuning ensures reliable, high-performance systems in demanding environments.
Conclusion
Tackling Azure SQL bottlenecks effectively means using a mix of established optimization strategies and Microsoft's suite of tools.
Start with the basics: leverage Query Store (enabled by default [4]) to track execution history. From there, tools like automatic tuning, including FORCE_LAST_GOOD_PLAN [4], can help revert inefficient execution plans automatically.
Focus your efforts on high-frequency queries rather than isolated slow operations. As Nawaz Dhandala wisely points out:
A query that takes 100ms but runs 100,000 times has more impact than a query that takes 10 seconds but runs once [4].
The bottlenecks we've covered - missing indexes, parameter sniffing, blocking, tempdb contention, and I/O issues - each come with specific ways to identify and resolve them, leading to noticeable performance gains.
Finally, tools like Azure SQL Insights and Query Performance Insight offer dashboards that track resource usage and send alerts, helping you stay ahead of potential problems.
FAQs
Which Azure SQL wait types are most important for troubleshooting?
Key Azure SQL wait types to be aware of when troubleshooting include:
- Lock waits: These often point to data contention issues, where multiple processes are trying to access the same data simultaneously.
- Page IO latch waits: These signal slow input/output performance, often caused by storage-related delays.
- Page latch update waits: These can indicate problems with file layout or contention over in-memory data structures.
Understanding and addressing these wait types can help tackle frequent database performance challenges.
When should I enable Automatic Tuning versus tuning manually?
Enable Automatic Tuning in Azure SQL to take advantage of AI-powered, continuous optimization with minimal effort. This feature handles tasks like index management and plan correction automatically, adjusting to workload changes without requiring constant oversight.
On the other hand, opt for manual tuning when you need fine-tuned control over performance. This approach is ideal for scenarios like creating custom indexes or addressing specific performance issues. While manual tuning can be more time-consuming, it allows for adjustments tailored to your unique requirements.
How do I know if I should optimize queries or scale up my service tier?
If you're experiencing delays due to issues like inefficient query plans or resource contention, it's time to optimize your queries. However, if the performance bottlenecks are a result of hitting resource limits - like CPU, memory, or I/O - and query optimization doesn't solve the problem, consider scaling up your service tier. Always aim to address the root cause to decide on the most effective solution.