Azure SQL Intelligent Insights: Benefits and Limits
Azure SQL Intelligent Insights helps you detect and address database performance problems early using AI-powered monitoring. It analyzes your database's behavior, identifies issues like memory pressure or TempDB contention, and provides actionable recommendations. However, it has some limitations, including dependency on a seven-day baseline, making it less effective for new or unpredictable workloads. Additionally, it only detects predefined patterns, so custom issues may require other tools like DMVs or Query Store.
Key Takeaways:
- Features: Detects 15 performance patterns, ranks issues by severity (1–3), and logs root cause analysis in diagnostic logs.
- Setup: Requires enabling the "SQLInsights" log category in diagnostics.
- Challenges: Baseline dependency can lead to false positives for fluctuating workloads; telemetry rounding affects low-activity databases.
This tool works best for stable, large-scale database environments but should be supplemented with other monitoring tools for more detailed insights.
Monitor and optimize operational resources in Azure SQL | DP-300 | Video 9
sbb-itb-79ce429
1. Azure SQL Intelligent Insights
This section dives into how Intelligent Insights keeps tabs on performance, evaluates impacts, and identifies operational limits.
Performance Monitoring Capabilities
Azure SQL Intelligent Insights simplifies diagnostics by analyzing your database telemetry. When it detects an issue, it conducts a root cause analysis and logs the results in the rootCauseAnalysis_s property of the diagnostic logs. This process ensures problems are tracked from the moment they're identified until they're resolved [1][2].
Detection Metrics and Patterns
The service uses an impact scoring system (ranging from 1 to 3) to rank detected behaviors, with a score of 3 indicating the most significant effect on performance [2]. To make these insights accessible, you’ll need to enable diagnostic settings and include the "SQLInsights" log category [2].
These metrics are designed to provide proactive diagnostics, though certain constraints might influence their precision.
Operational Constraints
For databases with minimal activity, telemetry rounding can lead to misleading usage data. For example, usage values below 0.5 are rounded down to zero, which may result in the Azure portal showing 0% usage even when queries are being processed [3]. If you're managing low-activity databases, consider using DMVs or Extended Events for more accurate insights [3].
Pros and Cons
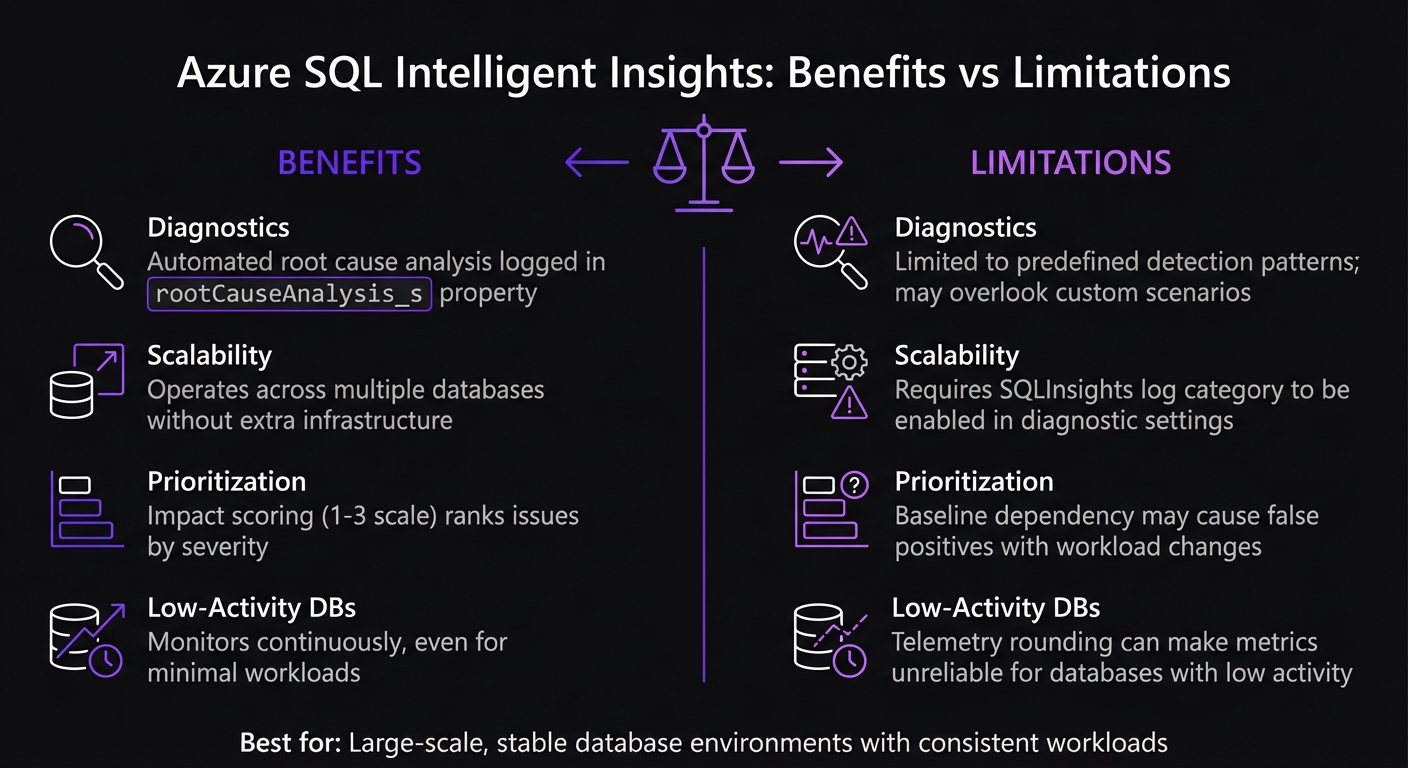
Azure SQL Intelligent Insights Benefits vs Limitations Comparison
Intelligent Insights takes the hassle out of manual telemetry reviews. Its impact scoring system prioritizes issues based on severity, helping you zero in on the most pressing problems. Plus, this AI-powered solution works across multiple databases without requiring additional infrastructure.
However, there are some challenges to consider. The system relies on baseline data to identify anomalies. If your database workloads fluctuate frequently or you're working with a new application, the baseline may not accurately represent typical behavior. This can lead to false positives or missed detections. It's a reminder of how crucial stable workloads are for accurate performance monitoring. Another limitation is that it only identifies predefined issues, meaning unique or application-specific problems might go unnoticed.
| Feature/Aspect | Benefits | Limitations |
|---|---|---|
| Diagnostics | Automated root cause analysis logged in rootCauseAnalysis_s property |
Limited to predefined detection patterns; may overlook custom scenarios |
| Scalability | Operates across multiple databases without extra infrastructure | Requires SQLInsights log category to be enabled in diagnostic settings |
| Prioritization | Impact scoring (1-3 scale) ranks issues by severity | Baseline dependency may cause false positives with workload changes |
| Low-Activity DBs | Monitors continuously, even for minimal workloads | Telemetry rounding can make metrics unreliable for databases with low activity |
This service shines when used with databases that maintain consistent workloads, as this ensures more reliable telemetry data.
Conclusion
Intelligent Insights shines in managing large-scale, stable database environments. It efficiently tracks issues throughout their lifecycle - from detection to resolution - and scales seamlessly across hundreds of thousands of databases, making it an excellent choice for estates where manual monitoring is simply not feasible [1].
To get the most out of this tool, enable the SQLInsights log category in diagnostics. This unlocks access to 15 detection patterns and a 1–3 impact scoring system that helps prioritize issues effectively [1][2]. The JSON diagnostics log also integrates smoothly with third-party tools using the issueId_d property, making it a versatile addition to your monitoring strategy [2].
While Intelligent Insights provides high-level root cause analysis, it doesn’t offer detailed troubleshooting. For deeper performance data, consider supplementing it with tools like Dynamic Management Views (DMVs) or the Query Store, which deliver low-latency, granular insights [3]. Keep in mind that for Azure SQL Managed Instance, Query Performance Insight isn’t available, so additional tools will be necessary [3].
This tool performs best in environments with consistent database activity. Frequent workload changes can disrupt baselines and lead to false positives. For advanced scenarios requiring granular trace data, combine Intelligent Insights with Extended Events to capture details that standard metrics might overlook [3]. Together, these features make Intelligent Insights a key component of a broader Azure SQL performance monitoring strategy.
FAQs
How long does Intelligent Insights need to learn my workload?
Azure SQL's Intelligent Insights keeps an eye on your database usage and spots performance issues using built-in AI. The system doesn't have a fixed timeline for fully learning your workload - it all depends on how complex and dynamic your database is. Over time, it continually adjusts and refines its analysis, delivering more precise insights as it collects additional data.
What should I use when Intelligent Insights misses a performance issue?
When Intelligent Insights overlooks a performance issue, you can turn to its diagnostics log or performance diagnostics log for a deeper dive. These logs offer detailed information that can help you pinpoint the problem and resolve it efficiently.
Why does the portal show 0% usage on low-activity databases?
The portal indicates 0% usage for low-activity databases because Intelligent Insights might not gather enough activity or performance data to provide actionable insights. With limited data available, it becomes challenging to analyze or report on performance trends, leading to minimal or zero utilization being displayed.