
If I had to sum this up in one line: HPA on AKS works best when I set clean resource requests first, scale on the right metric, and make sure pod scaling matches node capacity.
That’s the core idea. If CPU or memory requests are wrong, HPA reads a bad signal. If I use the wrong metric, scaling lags behind demand. And if pods scale faster than nodes, new pods can sit in Pending even though HPA did its job.
Here’s the short version:
- Set CPU and memory requests before tuning HPA
- Use CPU-only when CPU tracks load closely
- Add memory or app metrics when one signal is not enough
- Use
minReplicas,maxReplicas, and scale-down stabilization to reduce flapping - Check HPA status, metrics, pods, and node headroom together
- Use KEDA or custom metrics for queues, request rate, latency, and GPU-heavy apps
- Keep HPA and Cluster Autoscaler aligned
A few plain facts matter here:
- HPA changes pod count, not node count
- Utilization-based HPA depends on resource requests
- Queue-driven apps often scale better on queue depth than CPU
- GPU-heavy AI apps may look fine on CPU while the GPU is at 100%
In other words: good HPA is less about fancy YAML and more about clean inputs, sane limits, and the right metric for the job.
This article walks through the setups, checks, and scaling patterns I’d use on AKS to keep autoscaling steady and useful.
Azure AKS Scaling Options Explained: HPA Demo & Best Practices
sbb-itb-79ce429
Set Resource Requests and Limits Before Tuning HPA
If requests are off, HPA scales from a bad signal. A pod that asks for less CPU or memory than it actually needs will look more busy than it is, so HPA can scale too hard. If requests are too high, pods seem underused and HPA waits too long, even when the workload is under strain. In plain English: bad requests lead to bad HPA decisions.
Good request and limit settings should match how the workload behaves in practice, the node’s allocatable capacity, and how many pods you want on each node. Requests that are too low or too high throw off scaling. Limits can cause trouble too. If a limit sits too close to the request ceiling, throttling can add noise and blur the picture of what the app actually needs.
For production AKS workloads, set requests from measured steady-state load. Then keep limits high enough to avoid throttle-induced noise. That gives HPA a cleaner utilization signal, steadier scaling, and fewer false positives. Once requests and limits line up with how the app runs, you can tune replica rules and stabilization with a lot more confidence.
Request and Limit Strategies That Produce Reliable HPA Signals
Requests and limits are not just scheduling settings. They shape the signal HPA reads. If that signal is warped, every scaling rule built on top of it will be off too.
A good starting point is measured steady-state usage, not guesses. Look at how the workload runs over time, then size requests around that pattern. From there, check the node’s allocatable capacity and your target pod density. This keeps the math grounded in what the cluster can actually support.
Limits need care as well. Low CPU limits can throttle a pod before you see its true demand. That can make utilization look calmer than the workload feels from the user side. Memory limits are different, but the same idea applies: if settings are too tight, the signal gets messy fast.
QoS Classes, Evictions, and Common Configuration Errors
Requests and limits also affect a pod’s QoS class and its eviction priority when a node is under pressure. That matters for HPA because pods without requests are weak candidates for utilization-based scaling. Kubernetes needs a clean baseline to calculate utilization, and without requests, that baseline falls apart.
Three setup mistakes show up again and again on AKS:
- Missing requests, which leaves HPA without a solid utilization baseline
- Uneven requests across containers in the same pod, which skews pod-level utilization
- Low CPU limits, which can throttle pods and hide actual demand
Fixing those issues gives HPA a steadier baseline to work from, which makes the scaling patterns in the next section much easier to trust.
Proven HPA Configuration Patterns for AKS
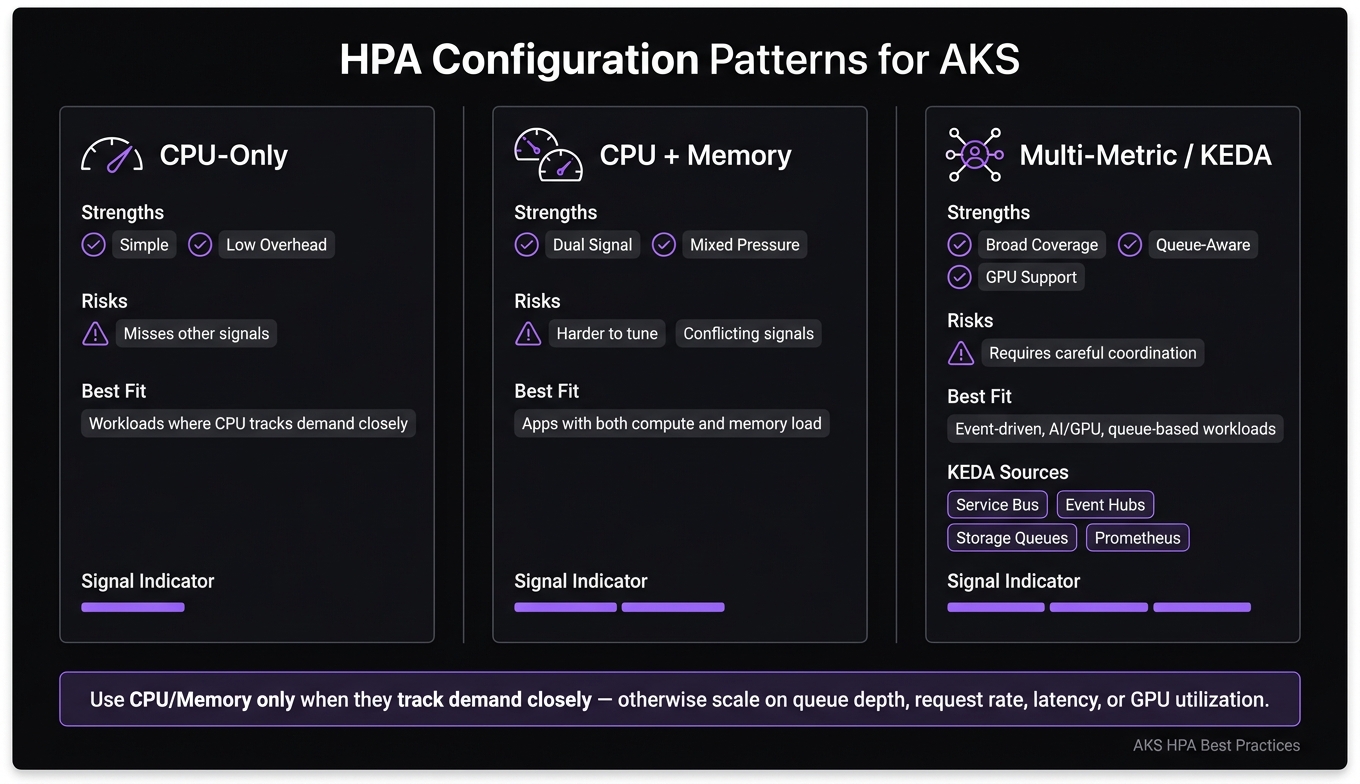
HPA Scaling Patterns on AKS: CPU-Only vs Multi-Metric vs KEDA
Once requests and limits are in place, HPA tuning is mostly about picking the right signals. On AKS, the main call is pretty simple: Can one metric reflect demand well enough, or do you need more than one?
CPU-Only, CPU Plus Memory, and Multi-Metric Patterns
The tradeoff here is simple versus better signal quality.
| Pattern | Strengths | Risks | Best Fit on AKS |
|---|---|---|---|
| CPU-Only | Simple and low overhead | Can miss other workload signals | Workloads where one metric tracks demand well |
| CPU and Memory | Adds a second demand signal | Harder to tune | Workloads with mixed CPU and memory pressure |
| Multiple Metrics | Broader demand coverage | Requires careful coordination | Workloads with complex demand |
CPU-only is the easiest place to start. It works well when CPU usage rises and falls in step with user demand. If that relationship is tight, this pattern keeps things clean and easier to manage.
CPU plus memory gives you another signal to watch. That can help when demand shows up in more than one way, especially for apps that use both compute and memory under load. The catch is that tuning gets harder. Two signals can help, but they can also pull scaling in different directions if you're not careful.
Multiple metrics cast a wider net. This pattern makes sense for workloads with more complex demand, where one or two signals don't tell the full story. The tradeoff is coordination. More inputs can mean better scaling decisions, but only if those inputs are set up in a way that doesn't create noise.
Scale-Down Stabilization and Replica Guardrails
To cut down on flapping, set minReplicas and maxReplicas first. Then use scale-down stabilization so the HPA doesn't drop replicas too fast when demand dips for a short stretch.
Think of these settings as guardrails. The metric pattern tells HPA when to act, and stabilization plus replica bounds help control how sharply it reacts. That combination usually leads to steadier scaling on AKS.
Monitor HPA with Azure and Kubernetes Tools
After you tune HPA, the next step is to make sure it responds the way the workload actually behaves. A good HPA setup on paper doesn’t mean much unless you check it in production.
Validate Metrics and Scaling Events in Real Time
Use kubectl to look at HPA status, replica changes, pod status, and node capacity side by side. That helps you tell the difference between an HPA problem, a metrics problem, and a node capacity problem.
If scaling seems off, compare HPA target metrics with live metrics from the Kubernetes Metrics API. If replicas stay stuck at the minimum or maximum, start with metrics, then check capacity. If HPA responds slowly, or doesn’t respond at all, look at the metrics source next, then confirm the cluster has enough headroom.
For event-driven workloads, KQL helps you see whether queue lag is dropping as replicas go up.
Pick the Right Observability Stack for HPA Tuning
Each tool shows a different layer of HPA tuning. Use the tool that matches the layer you want to inspect.
| Tool | Scope | Metrics Type | Typical AKS Use Case | Role in HPA Tuning |
|---|---|---|---|---|
kubectl |
Kubernetes objects and events | Status and resource data | Validate HPA behavior, replica changes, and pod status | Quick real-time validation |
| Kubernetes Metrics API | Cluster metrics feed | CPU and memory metrics | Feeds HPA metrics | Feeds HPA metrics |
| Azure Monitor | Cluster and node level | Platform metrics and logs | Cluster capacity monitoring | Confirm cluster headroom |
| Container Insights | Pod and container level | Workload metrics and logs | Workload performance tracking | Correlate scaling with app latency |
| KQL | Cross-resource queries | Log and metric queries | Correlate scaling events and lag over time | Useful for root cause analysis |
Use Azure Monitor to check node and cluster limits. Use Container Insights to look at pod-level behavior.
Advanced Scaling on AKS: Custom Metrics, KEDA, and AI Workloads
Multi-Metric HPA, Prometheus Adapters, and KEDA on AKS
CPU and memory are a good starting point. But at some point, they stop telling the full story.
When that happens, shift to workload-specific metrics. If queue depth, request rate, latency, or GPU utilization reflects demand better than CPU or memory, those are the signals to use.
Prometheus adapters can expose application metrics to HPA. That lets HPA scale based on what your app is actually doing, not just how hard the container is working.
KEDA is a strong fit for event-driven workloads on AKS. It works well with:
- Azure Service Bus
- Event Hubs
- Storage Queues
- Prometheus-based metrics
The big idea is simple: KEDA scales on workload signals, not just CPU and memory.
There’s one catch, and it matters a lot in production. If HPA or KEDA adds pods faster than AKS adds nodes, those new pods will sit in a Pending state until Cluster Autoscaler brings up capacity in the right node pool. In plain English, pod scaling and node scaling are tied together. Your app can ask for more pods all day, but if the cluster can’t place them, nothing moves.
So on AKS, application metrics and cluster capacity need to stay in sync.
Applying These Patterns to .NET and AI Agent Systems on AKS
These patterns map cleanly to .NET APIs and agent workloads on AKS.
For .NET APIs and worker services, request rate and queue depth often reflect load better than CPU or memory. That makes them better scaling signals in many cases.
For GPU-bound AI workloads, CPU and memory can be misleading. A pod may look fine on those metrics while the GPU is maxed out. In that setup, scale on GPU utilization instead.
Conclusion: The HPA Decisions That Matter Most
The practical rule is simple: use CPU and memory only when they track demand closely.
If they don’t, use custom metrics or KEDA to scale on the signals that matter most: queue depth, request rate, latency, or GPU utilization.
On AKS, workload metrics and cluster capacity must align.
FAQs
How do I know if my HPA metric is wrong?
Check whether HPA scaling lines up with what your app is actually using. The best way to do that is to compare scale activity with CPU, memory, request volume, and queue metrics in Azure Monitor and Application Insights.
If the signals don’t match the behavior, that’s a red flag. For example, you might see scaling happen too often, scaling happen at odd times, or no scaling at all even when traffic clearly jumps. Thresholds that sit too close together can also cause noisy behavior, with the app scaling up and down more than it should.
It also helps to look at your telemetry pipeline itself. HPA only reacts to the signals it receives. If those signals are delayed, patchy, or inconsistent, your scaling decisions can be off even when the app is behaving exactly as expected.
Why are my scaled pods stuck in Pending on AKS?
On Azure Kubernetes Service, scaled pods usually sit in Pending when the scheduler can't find a node with enough free CPU or memory for what the pod asks for. In plain terms, the pod is ready to run, but your current node pool doesn't have room for it.
This often happens when the pod's resource requests are higher than the capacity available on your existing nodes.
Check whether your cluster has enough capacity. If traffic spikes are part of the picture, make sure your cluster autoscaler is set up to add nodes when demand jumps. It also helps to monitor resource usage and review your HPA thresholds so scaling doesn't outpace the room you have in the cluster.
When should I use KEDA instead of standard HPA?
Use KEDA instead of standard HPA when your scaling logic needs more than CPU or memory. HPA works well for compute-heavy workloads. KEDA is a better fit when you need to scale from outside signals like queue depth, stream lag, or message counts.
That matters a lot in event-driven systems. If you're scaling background workers or message processors, you usually care about actual demand, not just resource use on the pod. In cases like Azure Service Bus or Storage Queues, KEDA can scale workloads based on the number of pending messages, which is often a much better signal.


