Load Testing Databases with Azure Tools
Database performance issues can derail your app when user traffic surges. Load testing lets you simulate high-traffic scenarios and identify bottlenecks before they impact users. Azure Load Testing simplifies this process with tools like Apache JMeter and Locust, enabling you to test up to 100,000 virtual users across databases like Azure SQL and Cosmos DB.
Key highlights:
- Integrated monitoring: Combines client-side metrics (response times, error rates) with server-side data (CPU usage, RU consumption).
- CI/CD integration: Automate tests with fail criteria to catch issues early.
- Scalable testing: Simulate massive workloads with up to 400 VMs.
- Real-time insights: Track metrics like response times and database usage during tests.
Azure Load Testing helps you configure test scripts, monitor database performance, and analyze results to optimize for peak efficiency. Whether it's throttling issues or connection pool limits, this tool provides clear insights to improve database reliability.
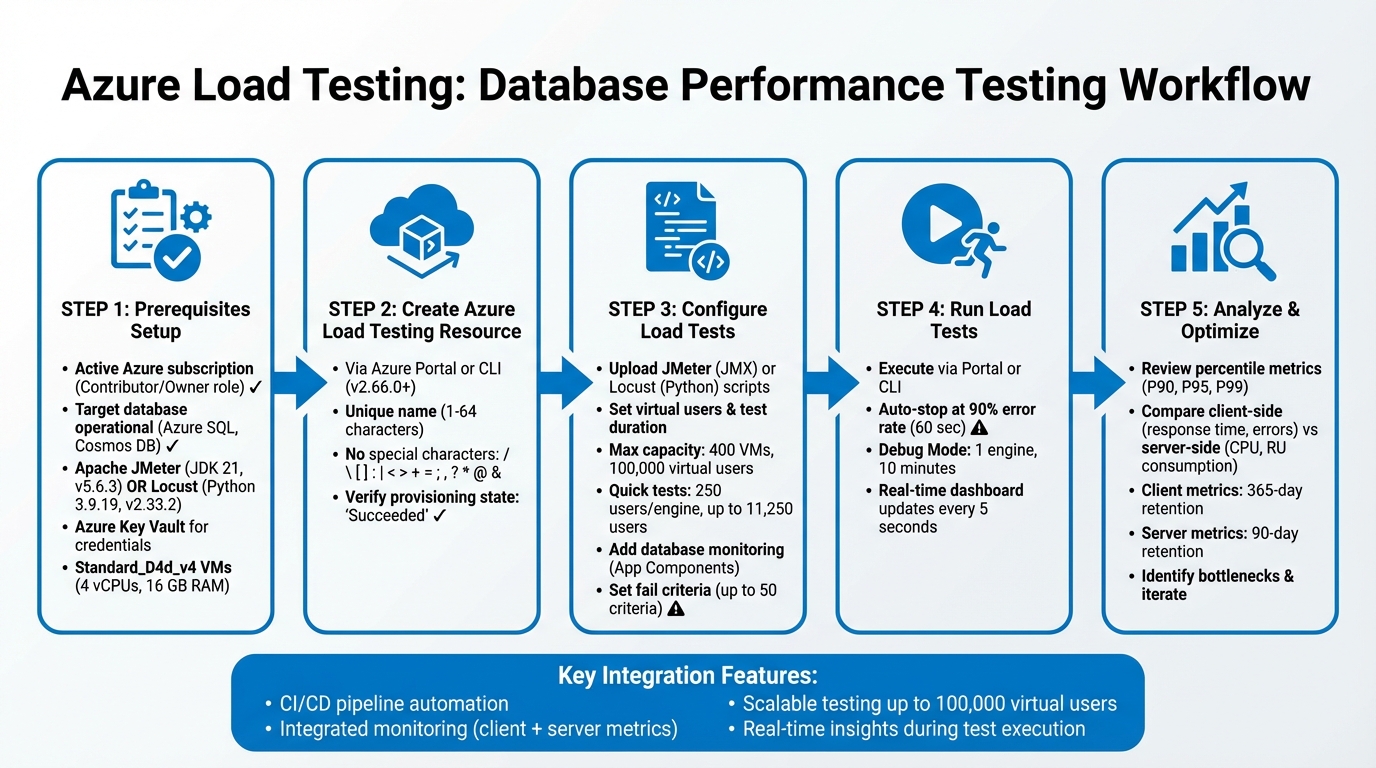
Azure Load Testing Setup and Execution Workflow for Database Performance Testing
Azure Load Testing Detailed Walkthrough
Prerequisites for Database Load Testing
To get started, you'll need an active Azure subscription with either a Contributor or Owner role. This is essential for deploying Azure Load Testing and accessing your target database .
Make sure your target environment is up and running. Whether you're using Azure SQL, Cosmos DB, or another TCP endpoint, the database should be fully operational and properly configured. If your database is behind private endpoints, deploy Azure Load Testing within the same Azure Virtual Network (VNET) to ensure connectivity .
Azure Load Testing works with Apache JMeter (via JDBC) and Locust (using Python libraries like pyodbc or pymongo) . JMeter tests run on JDK 21 (Apache JMeter 5.6.3), while Locust tests run on Python 3.9.19 (Locust 2.33.2). Each test instance operates on a Standard_D4d_v4 machine, equipped with 4 vCPUs and 16 GB of memory.
For security, store database credentials in Azure Key Vault. Use a managed identity for Azure Load Testing to access secrets, avoiding the need to hard-code sensitive information .
If you're using JMeter, make sure to upload all required JDBC drivers. For Locust, include a requirements.txt file listing the necessary Python database drivers . If any artifact files exceed 50 MB, compress them into a ZIP file before uploading. When referencing files, use their names only, as all files are stored in a single flat directory.
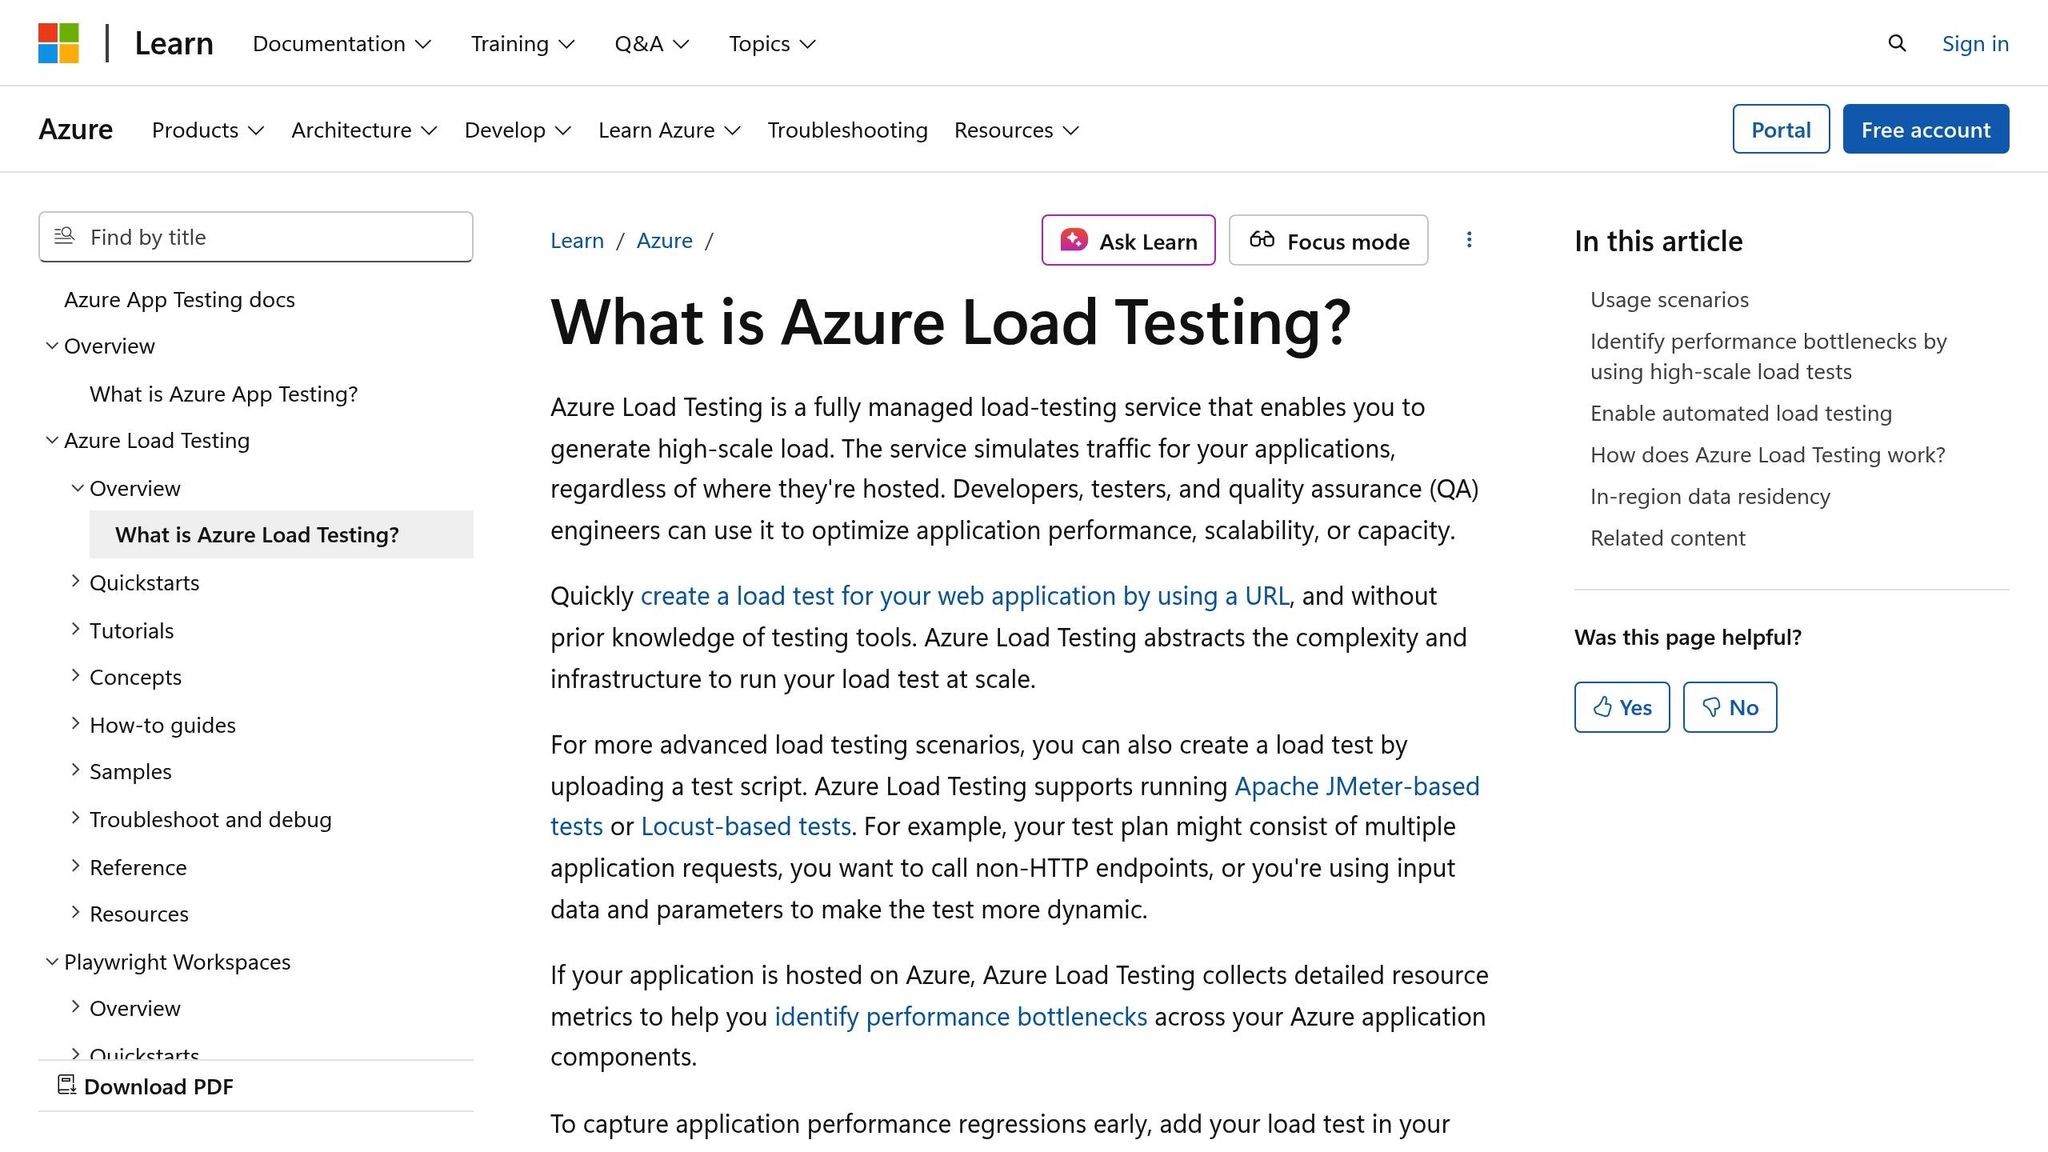
Setting Up an Azure Load Testing Resource
Azure Load Testing acts as the central hub for managing your test plans, results, and related artifacts. It’s the backbone of your test configuration and monitoring efforts. You can set it up using either the Azure portal or the Azure CLI.
To create it via the Azure portal, follow these steps:
- Sign in and select "Create a resource".
- Search for "Azure App Testing" and begin the setup process.
- Provide details like your subscription, resource group, a unique name (1–64 characters long), and location.
- Click "Review + Create", then hit "Create" to deploy the resource.
Keep in mind that resource names have specific rules. They cannot contain special characters (e.g., / "" []:|<>+=;,?*@&), whitespace, start with an underscore (_), or end with a period (.) or dash (-). Use a name that reflects its purpose, like sql-loadtest-prod or cosmos-perf-testing.
For those who prefer the CLI (version 2.66.0 or later), run the following command to create the resource:
az load create --name <resource-name> --resource-group <rg-name> --location <location>
Afterward, confirm the setup with:
az load show
Make sure the provisioning state shows "Succeeded" to verify everything is in order.
You can also add Tags to help organize your resources by project, environment, or cost center. If your database uses private endpoints, note that VNET settings should be configured later.
Once your Azure Load Testing resource is set up, you’re ready to move on to configuring load test parameters and database query scripts in the next steps.
Preparing and Configuring Load Tests for Databases
Once your Azure Load Testing resource is set up, the next step is to create test scenarios that mimic how users interact with your database. This involves crafting scripts, setting load parameters, and enabling database monitoring to evaluate performance under stress.
Configuring JMeter or Locust Scripts for Database Queries
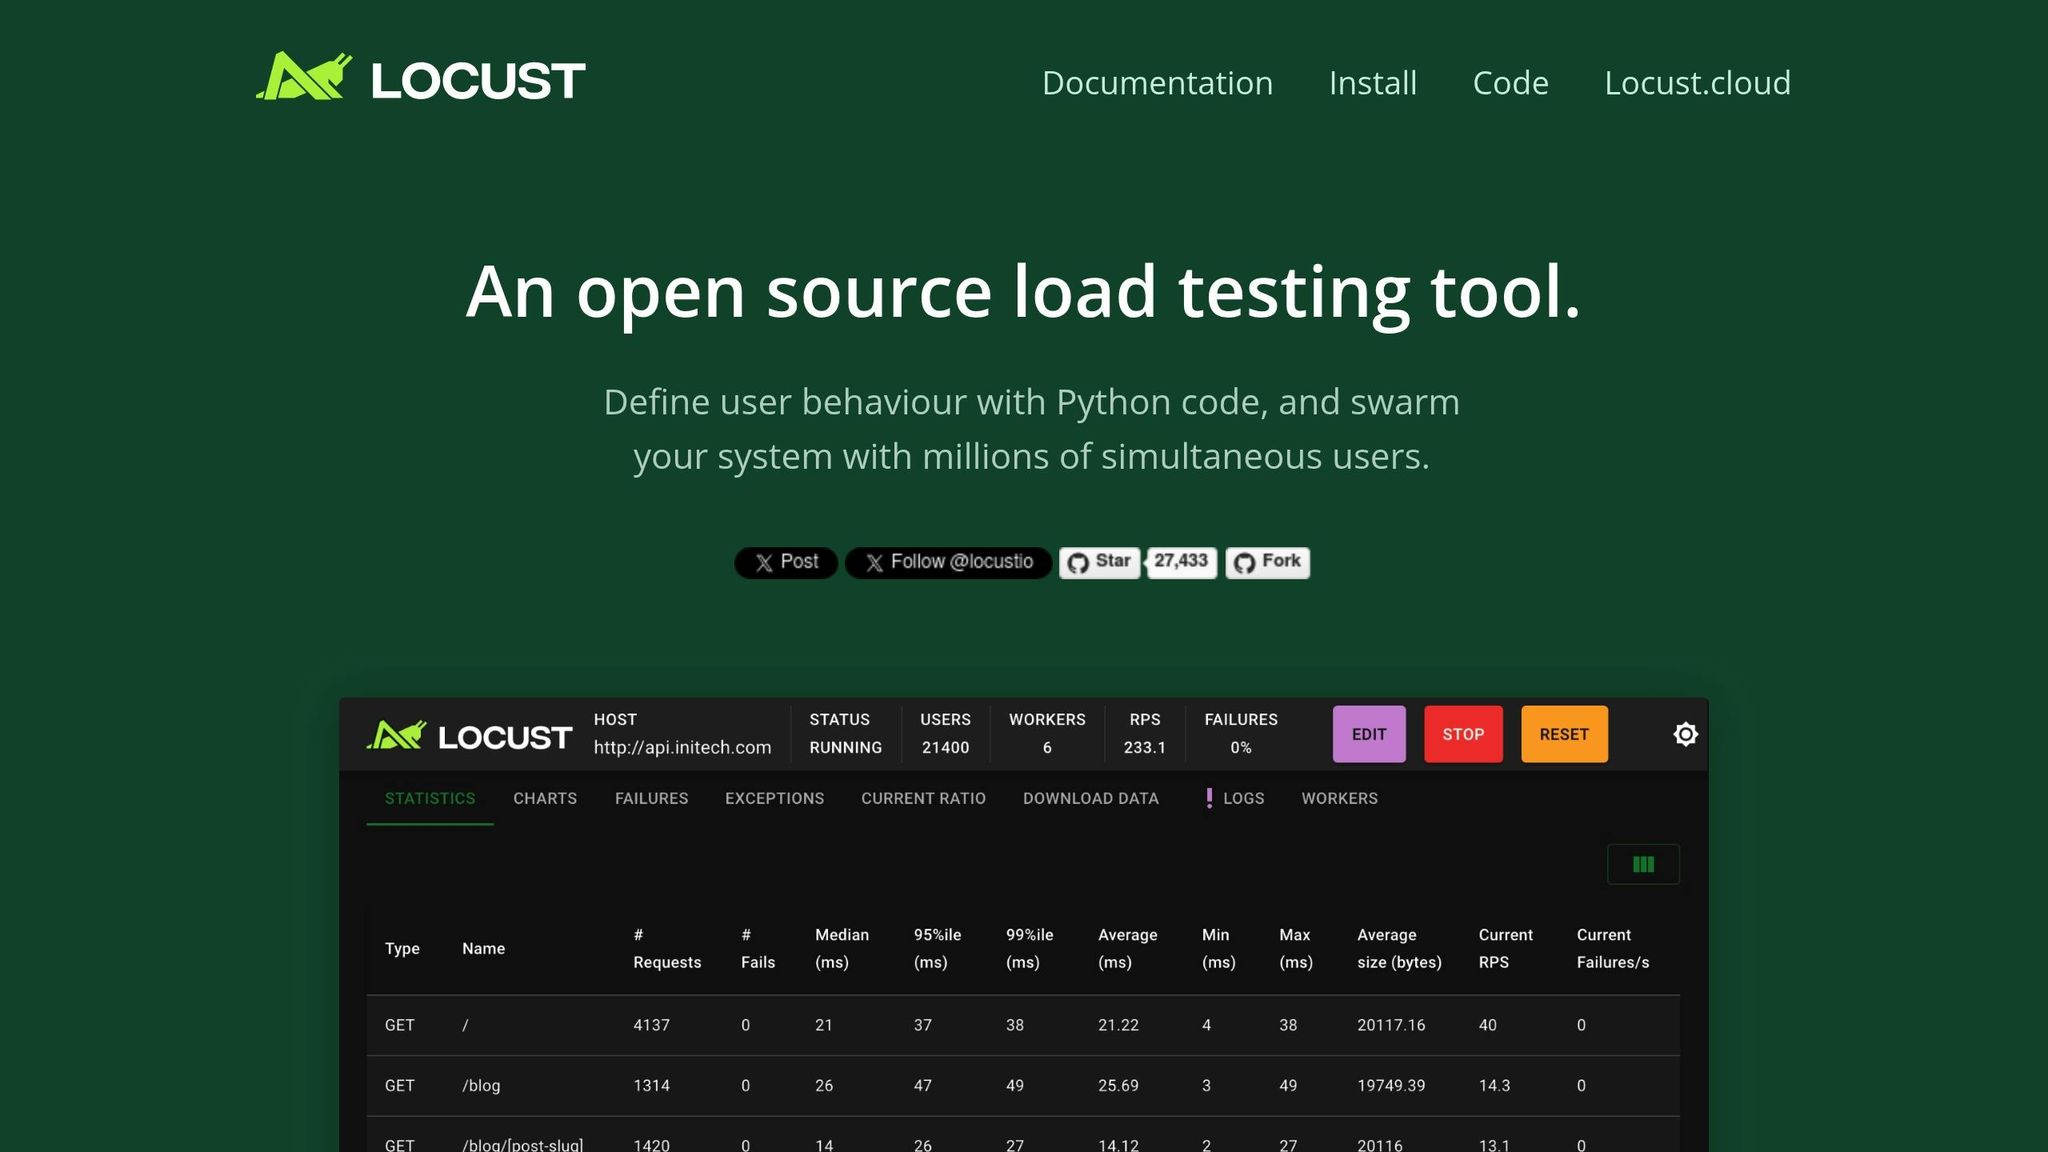
Azure Load Testing works with protocols supported by JMeter and Locust, including JDBC for JMeter and Python-based database clients for Locust. Picking one depends on your team's preferences - JMeter uses XML-based JMX files, while Locust relies on Python scripting.
In JMeter, database tasks are simulated using the JDBC protocol. Virtual users (threads) are defined in a Thread Group, and the overall load is calculated by multiplying the threads by the number of test engine instances (each running on a Standard_D4d_v4 VM).
For Locust, Python scripts define user behavior through classes like HttpUser or custom clients. You can set the total user load in the Azure configuration or a configuration file. Any required database drivers or libraries should be listed in a requirements.txt file. Note that Locust tests run on Python 3.9.19 and Locust version 2.33.2.
To replicate real-world traffic, add delays between queries - use wait_time = between(min, max) in Locust or Timers in JMeter. Gradually increase the load with a ramp-up period (in seconds for JMeter or as a spawn rate in Locust). For advanced patterns like traffic spikes or waves, Locust supports custom LoadTestShape classes.
If your test requires unique data, upload CSV files containing variables like user IDs. Azure Load Testing ensures these files are evenly distributed across test engine instances, so each uses distinct data. Avoid hard-coding sensitive information like connection strings or passwords. Instead, use Azure Key Vault secrets or environment variables for secure access.
Once your scripts are ready, move on to defining the load test parameters in Azure.
Setting Load Test Parameters in Azure
Upload your script to Azure Load Testing and configure settings like virtual users, test duration, and ramp-up speed. The total load is determined by multiplying the virtual users in your script by the number of test engine instances.
For quick URL-based tests, Azure Load Testing supports up to 250 virtual users per engine instance, scaling to 11,250 users. For script-based tests, the service can scale up to 400 engine instances, potentially simulating 100,000 virtual users depending on the complexity of your scripts.
Use environment variables for non-sensitive data, such as database hostnames, and rely on Key Vault secrets for credentials like JDBC connection strings. If your database is protected by a firewall or uses private endpoints, configure the subnetId in the YAML file to allow test engine VMs to access your virtual network.
Set an auto-stop threshold (default: 90% error rate over 60 seconds) to avoid unnecessary costs. For debugging, you can enable "Debug Mode", which runs a single engine for 10 minutes, letting you inspect logs without consuming significant resources.
Adding Database Monitoring and Test Criteria
Once the load test parameters are configured, integrate monitoring to track both client and server-side metrics. To monitor your database during testing, add your Azure SQL or Cosmos DB resource as an App Component in the Azure Load Testing configuration. The platform automatically selects key metrics for your database type - like CPU usage or database read counts - but you can adjust these via the Configure > Metrics menu.
Set fail criteria to determine if a test passes or fails. For example, you might flag a test if the average response time exceeds 300 ms or if the error rate is higher than 5%. Up to 50 criteria can be applied to both client-side metrics (e.g., response time, latency, error rate) and server-side metrics (e.g., database CPU usage, memory usage, or Cosmos DB's Normalized RU Consumption).
For instance, a 2025 Microsoft tutorial tested a Node.js API using Azure Cosmos DB. Initially, the database was set to 400 RUs, causing Normalized RU Consumption to hit 100% early in the test, which led to high response times for API requests. By reviewing server-side metrics in the Azure Load Testing dashboard, the team identified a throughput bottleneck and increased the provisioned throughput to 1,200 RUs. A follow-up test confirmed RU consumption stayed below 100%, and response times improved significantly.
As shown in this example, server-side metrics can quickly reveal bottlenecks. Ensure the load testing resource's managed identity has the "Monitoring Reader" role on the database. Keep in mind, client-side metrics are stored for 365 days, while server-side metrics are retained for 90 days.
sbb-itb-79ce429
Running Load Tests and Monitoring Performance
After configuring your test, you can execute it either through the Azure portal or the command line. Using the portal is simple: go to Tests, select the desired test, and click Run. You’ll have the option to add a description or adjust parameters in the confirmation pane before starting. The service will then deploy your scripts to test engine instances and initiate the simulation.
If you prefer the command line, the Azure CLI offers a flexible alternative. Here’s an example command:
az load test-run create --load-test-resource $loadTestResource --test-id $testId --test-run-id $testRunId --display-name $displayName --description "Description"
To keep your test runs organized, generate a unique test run ID using a timestamp, like so:
testRunId="run_$(date +"%Y%m%d_%H%M%S")"
This ensures clarity when reviewing results later. Should any issues arise or if you need to control costs, you can stop a test manually in the portal at any time. Both the portal and CLI methods offer flexibility depending on your workflow needs.
Running Load Tests via Azure Portal or CLI
The Azure portal is user-friendly for manual test runs, while the CLI is better suited for automation and integration into CI/CD pipelines. For those who need real-time insights, you can also retrieve metrics programmatically with this command:
az load test-run metrics list --load-test-resource $loadTestResource --test-run-id $testRunId --metric-namespace LoadTestRunMetrics
Providing detailed descriptions for each test run is a good practice, as it makes it easier to distinguish between configurations when analyzing results. Once a test is live, monitoring performance in real time becomes essential for identifying and addressing bottlenecks.
Tracking Client and Server Metrics in Real Time
The test run dashboard updates automatically every five seconds, displaying both client-side and server-side metrics. Client-side metrics include:
- Average and 90th percentile response times
- Request throughput
- Error percentage
- Active virtual users
Server-side metrics depend on the database you're using. For example, with Azure Cosmos DB, you might track Normalized RU Consumption and Provisioned Throughput, while for Azure SQL, you could monitor metrics like CPU percentage and memory usage.
Analyzing Results and Optimizing Database Performance
Once your tests are complete, the dashboard provides detailed metrics to help you evaluate performance. Start by focusing on percentile response times rather than just averages. Why? Because averages can be misleading. For instance, if your P90 or P95 values are high, it means a significant portion of users experienced delays, even if the average looks fine. For a deeper dive, P99 values are especially useful for spotting extreme outliers and understanding how the slowest requests behave under load. From there, analyze specific metrics from individual test runs to zero in on potential issues.
Reading Single Test Run Metrics
The dashboard's filters can help you identify patterns in performance. Look for a linear increase in throughput as the number of active users grows. If throughput plateaus, it often signals that your system has hit a processing limit.
High latency paired with low connect times is a red flag for backend or database processing delays, rather than network issues.
"The golden rule for performance analysis is: when you observe a degradation in any Client-Side metric (e.g., increased response time), immediately check the corresponding Server-Side metrics at the same time to see which resource is hitting its limits." - NashTech Blog
For Azure SQL databases, keep an eye on DTU or CPU percentage and concurrent connections. If you're using Cosmos DB, monitor Normalized RU Consumption - hitting 100% utilization here means your database is throttled, leading to higher latency and errors.
Comparing Results Across Multiple Test Runs
Once you've analyzed a single test run, it's time to compare results from multiple runs to track performance changes over time. Azure Load Testing stores a complete history of test runs, making it easy to compare results side by side. For example, after scaling up database throughput or optimizing an index, use the Rerun button to execute the test with the same parameters. This ensures a fair comparison and helps you focus on improvements in P90 or P95 response times rather than being distracted by averages.
Finding and Fixing Bottlenecks
When analyzing bottlenecks, match spikes in client-side metrics with corresponding server-side data. If certain API calls show higher error rates compared to others, the issue is likely tied to database performance. For compute-bound problems, check if your database resources are consistently running at 80–100% CPU utilization.
Also, don’t overlook the test engines themselves. If their CPU or memory usage exceeds 75%, consider adding more engine instances to handle the load effectively.
Conclusion
Azure Load Testing helps uncover performance issues before deployment, offering a clear view of potential bottlenecks. By analyzing both client and server metrics, teams can pinpoint challenges like database throttling, connection pool exhaustion, or other resource constraints. These insights provide a roadmap for making informed fixes and planning capacity effectively across your database environment.
Using test metrics to drive decisions allows for precise scaling adjustments. As mentioned earlier, monitoring server-side metrics during load tests can highlight specific problems, enabling teams to implement targeted solutions that address performance gaps effectively.
Integrating these load tests into your CI/CD pipeline ensures early detection of regressions. By setting fail criteria for metrics like error rates or response times, your pipeline can automatically flag runs that fall short of reliability standards. This "shift-left" strategy addresses database issues during development, long before they reach production.
Tracking tail latency metrics (P90, P95, P99) sheds light on worst-case user experiences. Azure Load Testing's comparison tools let you validate whether optimizations - like adding indexes or scaling throughput - have resolved identified problems. With its ability to simulate production-like conditions at scale, Azure Load Testing ensures realistic and reliable performance testing. By continuously refining test parameters and monitoring latency, your team can maintain peak database performance in production.
FAQs
How do I keep my database credentials secure during load testing?
To keep your database credentials safe during load testing, rely on secrets management tools and environment variables. These methods ensure sensitive information stays secure and isn't directly included in your code or test scripts, reducing the chance of accidental exposure.
For even greater protection, consider using managed identities. This feature allows your Azure Load Testing resources to securely access secrets stored in Azure Key Vault without requiring manual credential management or rotation. Azure handles the credentials automatically, cutting down the risk of leaks during testing and simplifying the authentication process.
What are the advantages of using Azure Load Testing in CI/CD pipelines?
Integrating Azure Load Testing into your CI/CD pipelines can make a big difference in how you handle application performance. By embedding this process into development workflows, teams can automatically check how an application performs as they build it. This means potential bottlenecks or slowdowns can be spotted and addressed early, long before the application reaches production. The result? Fewer surprises and a smoother user experience when it matters most.
Automated load testing in CI/CD pipelines also provides developers with continuous performance feedback. This makes it easier to identify regressions or performance dips caused by recent code changes. Plus, it allows teams to simulate high-traffic scenarios, testing how well an application can handle real-world demands - all without needing manual effort.
Incorporating this into your workflow not only speeds up development but also leads to more dependable releases. It builds confidence that your application can meet performance expectations, making it a must-have for efficient and reliable software delivery.
What do percentile response times mean in load testing results?
Percentile response times are a handy way to measure how well your system handles requests under pressure. For instance, the 90th percentile means that 90% of your requests are completed within a specific time, while the slowest 10% take longer. This helps you gauge performance for most users while pinpointing areas where things might slow down.
Looking at higher percentiles, like the 99th or 99.9th, can reveal those rare but critical worst-case scenarios - what’s often referred to as tail latency. These metrics are essential when setting performance benchmarks and ensuring your application runs smoothly, even during peak demand. By diving into percentile data, you can create realistic SLAs and tackle performance hiccups affecting smaller, yet important, portions of your requests.