Top Tools for Azure Workload Performance Tuning
Managing Azure workloads effectively can save you up to 33% in costs while improving performance. Poorly optimized workloads lead to higher expenses, slower applications, and potential downtime. This guide covers six key tools to help you monitor, analyze, and optimize Azure environments for better performance and cost efficiency:
- Azure Monitor: Tracks infrastructure metrics like CPU, memory, and disk usage across Azure services.
- Application Insights: Focuses on application-level performance, identifying slow code paths and bottlenecks.
- Azure Log Analytics: Centralizes logs and metrics for deep analysis and troubleshooting.
- Container Insights: Monitors Kubernetes clusters and container performance in real-time.
- AppStream Studio: Offers expert-led Azure architecture optimization for industries with strict compliance needs.
- Azure Advisor: Provides tailored recommendations to improve performance, reduce costs, and enhance security.
These tools can be combined to build a robust performance tuning strategy, balancing real-time monitoring with actionable insights. Whether you're managing applications, containers, or hybrid setups, these solutions help ensure efficient resource use and better user experiences.
Under the Hood: Optimizing Azure applications for performance and efficiency | BRK179
1. Azure Monitor
Azure Monitor is Microsoft’s built-in monitoring platform designed to gather, analyze, and act on data from both cloud and on-premises environments. It’s a cornerstone for understanding the performance of your Azure infrastructure, offering valuable insights into workloads. The platform stores metrics in a time-series database and leverages Log Analytics for deeper analysis. Let’s take a closer look at how Azure Monitor handles both application and infrastructure metrics.
Monitoring Scope (Application vs. Infrastructure)
Azure Monitor covers both application and infrastructure layers, with a strong focus on infrastructure monitoring. It keeps tabs on performance metrics across virtual machines, containers, Kubernetes clusters, and a wide range of Azure services like Azure Kubernetes Service (AKS), App Services, SQL Server, and Cosmos DB. From a single dashboard, you can track critical metrics such as CPU usage, memory consumption, disk I/O, request rates, response times, and error rates.
For Azure PaaS offerings like Azure App Service, Azure Event Hubs, and Azure SQL Database, Azure Monitor automatically captures essential metrics - such as throughput, CPU and I/O usage, data transfer volumes, and error counts - giving you instant visibility into your resources without extra setup. Additionally, the platform extends its capabilities to hybrid and multi-cloud environments through integrations with tools like Prometheus and Grafana. However, Azure Monitor works best when Azure resources dominate your infrastructure.
Data Collection Method (SDK-based vs. Automatic)
Azure Monitor uses a dual approach for data collection: metrics and logs. Metrics, stored in a time-series database, are ideal for quick detection and alerting, while logs provide detailed telemetry to help diagnose performance issues. By centralizing data from both IaaS and PaaS resources into a Log Analytics workspace, Azure Monitor reduces redundancy and optimizes costs.
The platform also supports distributed tracing, live metrics streaming, and advanced analytics, thanks to its integration with Log Analytics and Application Insights. For data collection, it employs agents for IaaS resources and agentless methods for PaaS, ensuring flexibility across different environments.
Alerting and Diagnostic Capabilities
Azure Monitor’s smart alerting system uses dynamic thresholds powered by machine learning to identify genuine anomalies. This reduces unnecessary alerts, helping you focus on critical issues. Custom dashboards display key metrics, while Log Analytics integration allows you to use the Kusto Query Language (KQL) for trend analysis and root cause investigation. Automated responses can also be set up using tools like Azure Logic Apps, enabling your infrastructure to adjust seamlessly to changing demands.
Integration with the Azure Ecosystem
Azure Monitor integrates seamlessly with core Azure services, offering a unified view of both infrastructure and applications. It works natively with Azure Log Analytics and Application Insights to enhance monitoring capabilities and supports role-based access control (RBAC) for precise access management. Its pay-as-you-go pricing model, which includes free basic logs, eliminates the need for additional licensing fees, making it cost-efficient.
For added flexibility, Azure Monitor is compatible with third-party monitoring tools, allowing you to extend its functionality. Its scalability ensures it can adapt to the demands of growing and evolving infrastructures, making it a versatile option for businesses leveraging Azure.
2. Application Insights
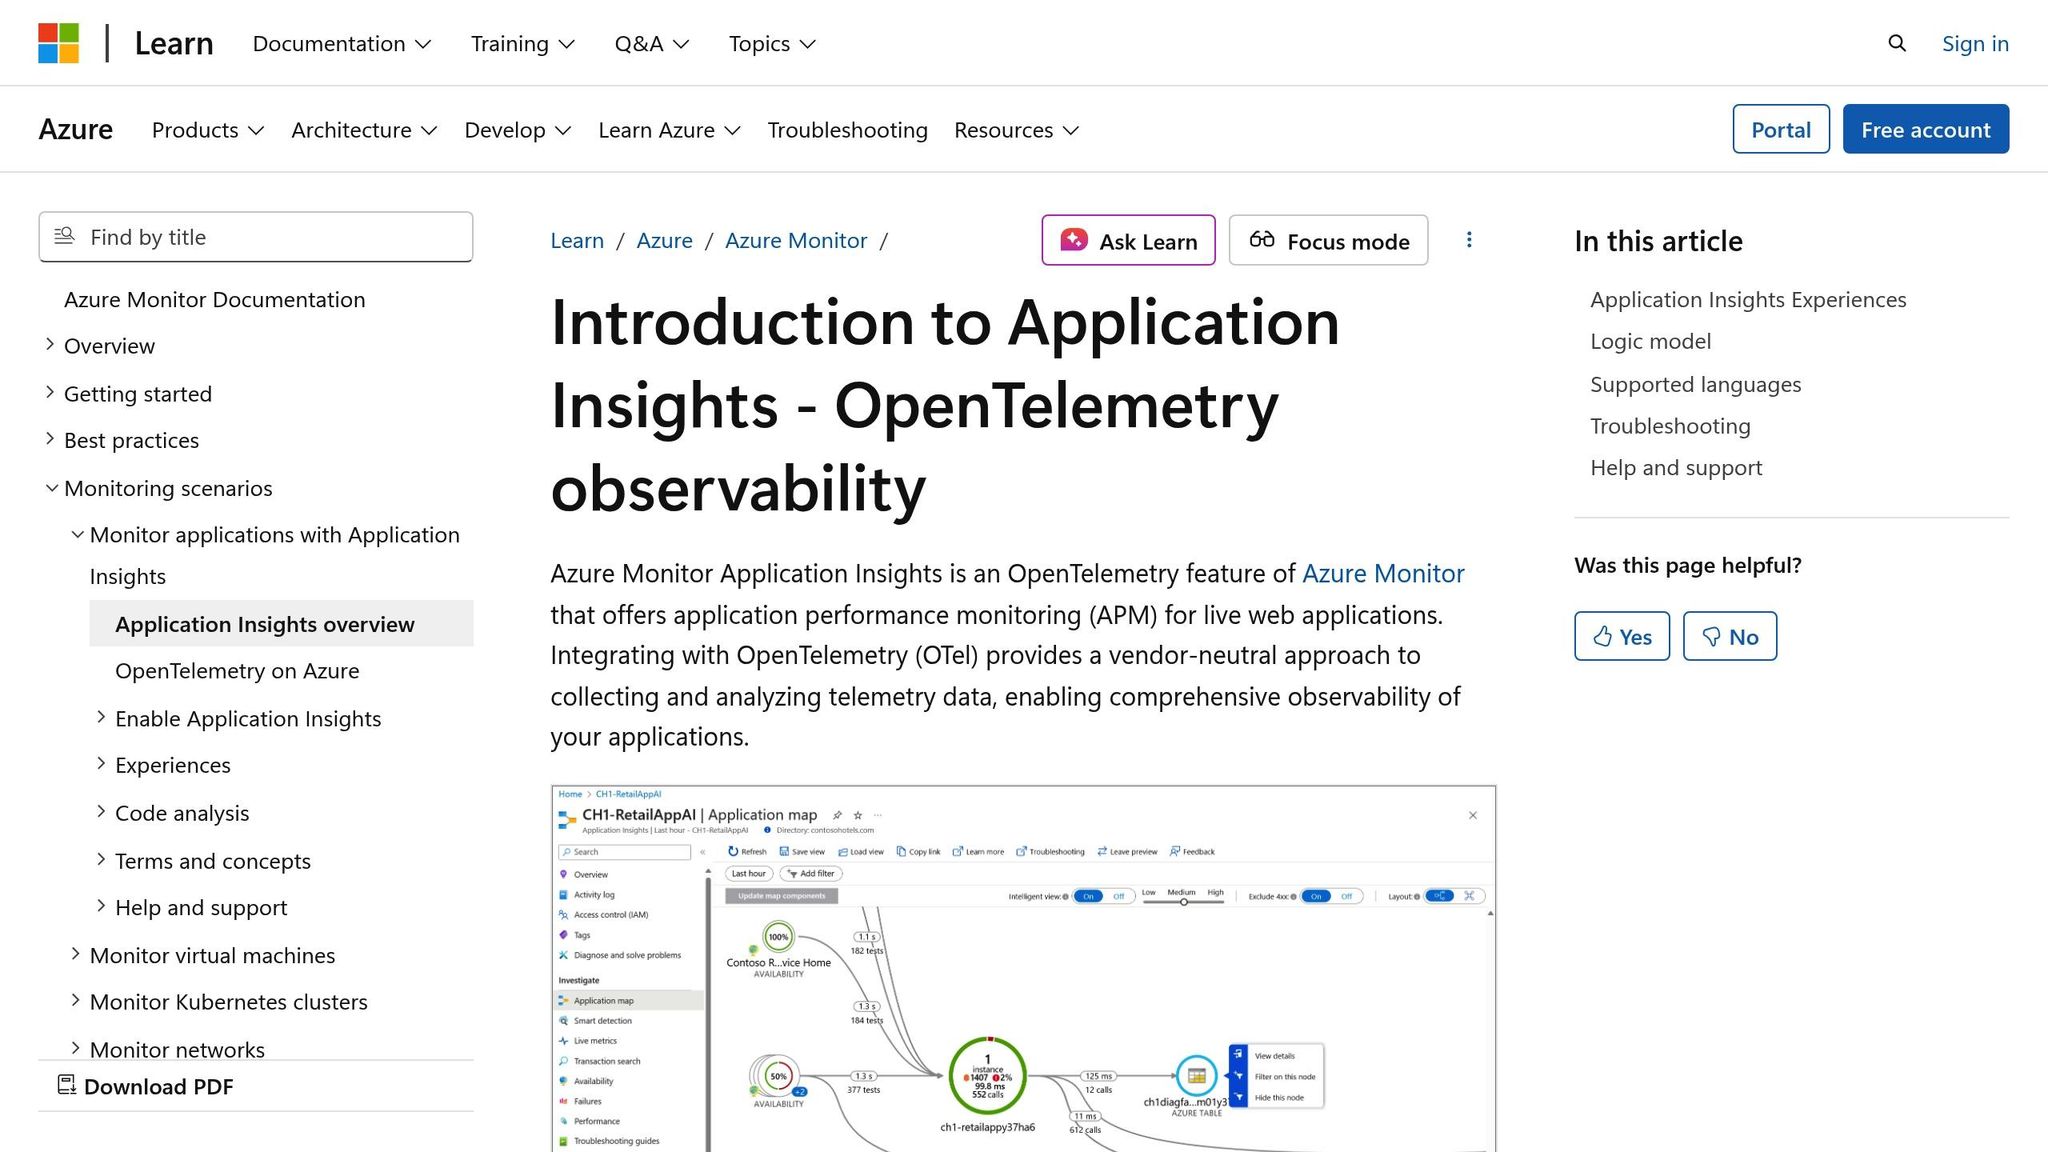
Application Insights is an Application Performance Monitoring (APM) service designed to keep tabs on how your applications perform in real time. While Azure Monitor focuses on the health of your infrastructure, Application Insights zeroes in on application-level performance. It tracks how your code runs and how users interact with your application, making it a go-to tool for development teams aiming to fine-tune workload performance from the inside out.
Monitoring Scope: Application vs. Infrastructure
Application Insights specializes in monitoring application performance, offering a detailed, user-focused view of your Azure workloads. It collects telemetry data such as response times, error rates, dependency tracking, and user behavior patterns. Unlike infrastructure monitoring tools that focus on CPU or memory usage, Application Insights dives into your code, identifying which functions are slow, pinpointing bottlenecks, and analyzing application logic.
The tool integrates seamlessly with Azure's serverless options, including Azure Functions, Logic Apps, and API Management services. For Azure Functions, it tracks critical metrics like execution times, failure rates, and cold start durations. When it comes to Logic Apps, it monitors workflow execution, highlighting which actions consume the most time and resources. This insight helps you refine workflows and cut down on execution costs.
For containerized environments, Application Insights works hand-in-hand with Container Insights to monitor workloads running on Azure Kubernetes Service (AKS). This dual-layer monitoring approach lets you connect the dots between application slowdowns and container-level issues, whether they stem from your code, resource limitations, or Kubernetes orchestration. This level of detail paves the way for precise alerting and faster diagnostics.
Data Collection: SDK-Based vs. Automatic
Application Insights gathers telemetry data using two main methods: SDK-based integration and automatic instrumentation.
- SDK-based integration involves embedding the Application Insights SDK directly into your application code. This gives you full control over what data is collected, allowing for custom event tracking.
- Automatic instrumentation, on the other hand, is a quicker option. It requires minimal code changes and can be enabled through the Azure portal or via agent deployment. This makes it ideal for scenarios where speed and simplicity are key.
Both methods provide the flexibility needed for timely alerts and effective diagnostics.
Alerting and Diagnostics
Application Insights offers powerful alerting tools to help you identify performance anomalies. You can create custom alerts based on specific metrics and thresholds, defining what constitutes unusual behavior for your application. These alerts are complemented by robust diagnostic features, including detailed transaction tracing. This tracing maps out the entire flow of requests through your application's components and dependencies.
When issues arise, the platform's root cause analysis digs into the contextual data to pinpoint the source of the problem. Comprehensive error tracking captures exceptions and failures, giving developers the insights they need to resolve issues quickly. Together, these tools help reduce mean time to resolution (MTTR), enabling your team to address incidents faster and more effectively.
Integration with the Azure Ecosystem
Application Insights integrates seamlessly with other Azure tools like Azure Monitor, Log Analytics, and DevOps, creating a unified observability platform. This integration allows teams to correlate application performance data with infrastructure metrics and logs for a complete picture of system health.
By acting as a bridge between development and operations teams, Application Insights ensures both sides are aligned - developers can focus on code performance while operations teams manage the underlying infrastructure.
One aspect to keep in mind is cost. Application Insights pricing is based on the volume of telemetry data ingested and stored. For larger deployments, you can manage costs by implementing sampling strategies to reduce the volume of collected data while maintaining statistical accuracy. Filtering out unnecessary data and setting appropriate retention policies are also effective ways to control expenses.
3. Azure Log Analytics
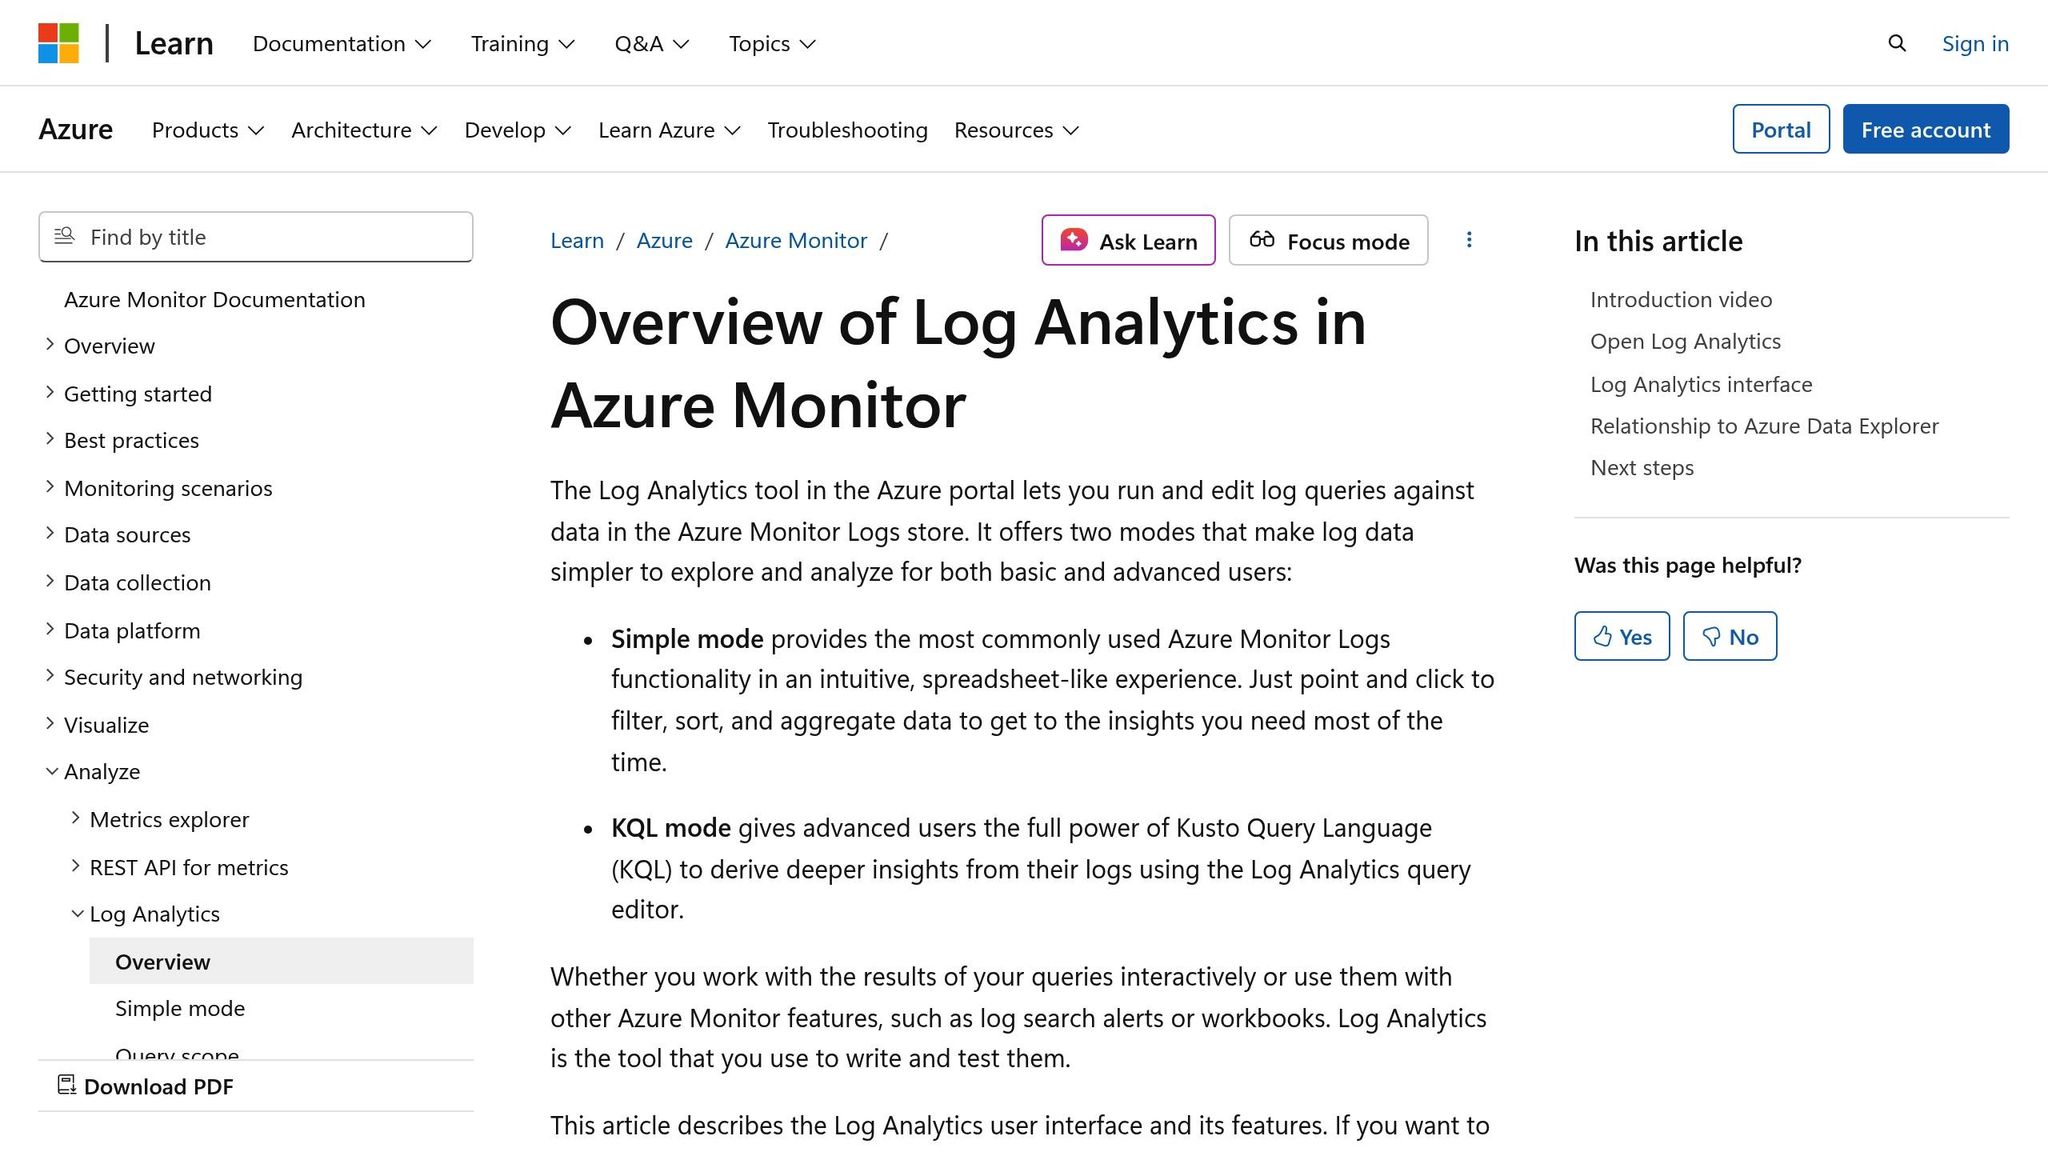
Azure Log Analytics acts as the central hub for data within the Azure Monitor ecosystem, gathering and analyzing telemetry from both cloud and on-premises environments. It consolidates logs and metrics from virtual machines, containers, databases, and applications into a single platform, making it easier to detect patterns and troubleshoot issues quickly. Its monitoring capabilities extend across both infrastructure and application layers, providing a unified view of your systems.
Monitoring Scope: Application and Infrastructure
While Application Insights focuses primarily on application performance, Azure Log Analytics takes a broader approach, monitoring both infrastructure and applications. It collects key performance data like CPU usage, memory consumption, disk I/O, network traffic, and storage metrics from your infrastructure. At the same time, it captures application-specific details such as transaction traces, diagnostic logs, and performance metrics from Azure services. This dual-layer monitoring covers over 40 Azure services, including virtual machines, Azure Kubernetes Service (AKS), Azure Functions, Logic Apps, and API Management. This extensive coverage enables teams to fine-tune performance and manage costs more effectively. All of this is supported by flexible and mostly automated data collection methods, which we'll dive into next.
Data Collection Method: Flexible and Automated
Azure Log Analytics simplifies data collection with an agentless setup for most Azure services, automatically gathering logs and metrics without manual intervention. For deeper monitoring, agents can be deployed using protocols like SNMP, UDP, TCP, WinRM, and WMI. The platform also supports custom metrics, allowing you to track application-specific data alongside standard infrastructure metrics. Its time-series data storage design ensures efficient storage and fast retrieval, while KQL (Kusto Query Language) helps uncover hidden performance trends.
Alerting and Diagnostic Capabilities
To minimize unnecessary notifications, Azure Log Analytics uses smart alerts with dynamic thresholds that adapt to normal performance fluctuations. By correlating metrics with logs, it helps identify not just what went wrong but also why it happened. Integrated with Azure Monitor Metrics, the platform enables quick analysis during critical moments, and its machine learning–powered anomaly detection identifies irregularities that might otherwise go unnoticed. This approach ensures that teams can focus on the most pressing issues while following standard processes for less urgent matters.
Integration with the Azure Ecosystem
Azure Log Analytics works seamlessly with other Azure tools like Azure Monitor, Application Insights, and Azure Advisor. It supports automation through Azure Logic Apps, allowing you to create workflows that automatically respond to performance issues. Access control is managed through Azure Role-Based Access Control (RBAC), ensuring centralized monitoring while restricting data access to the appropriate teams. For those using open-source visualization tools, Log Analytics integrates with Prometheus and Grafana. It also provides pre-built dashboards and the option to customize views, highlighting the metrics that matter most to your organization. Operating on a pay-as-you-go model with a free tier for basic logs, Azure Log Analytics offers a scalable solution suitable for businesses of all sizes.
4. Container Insights
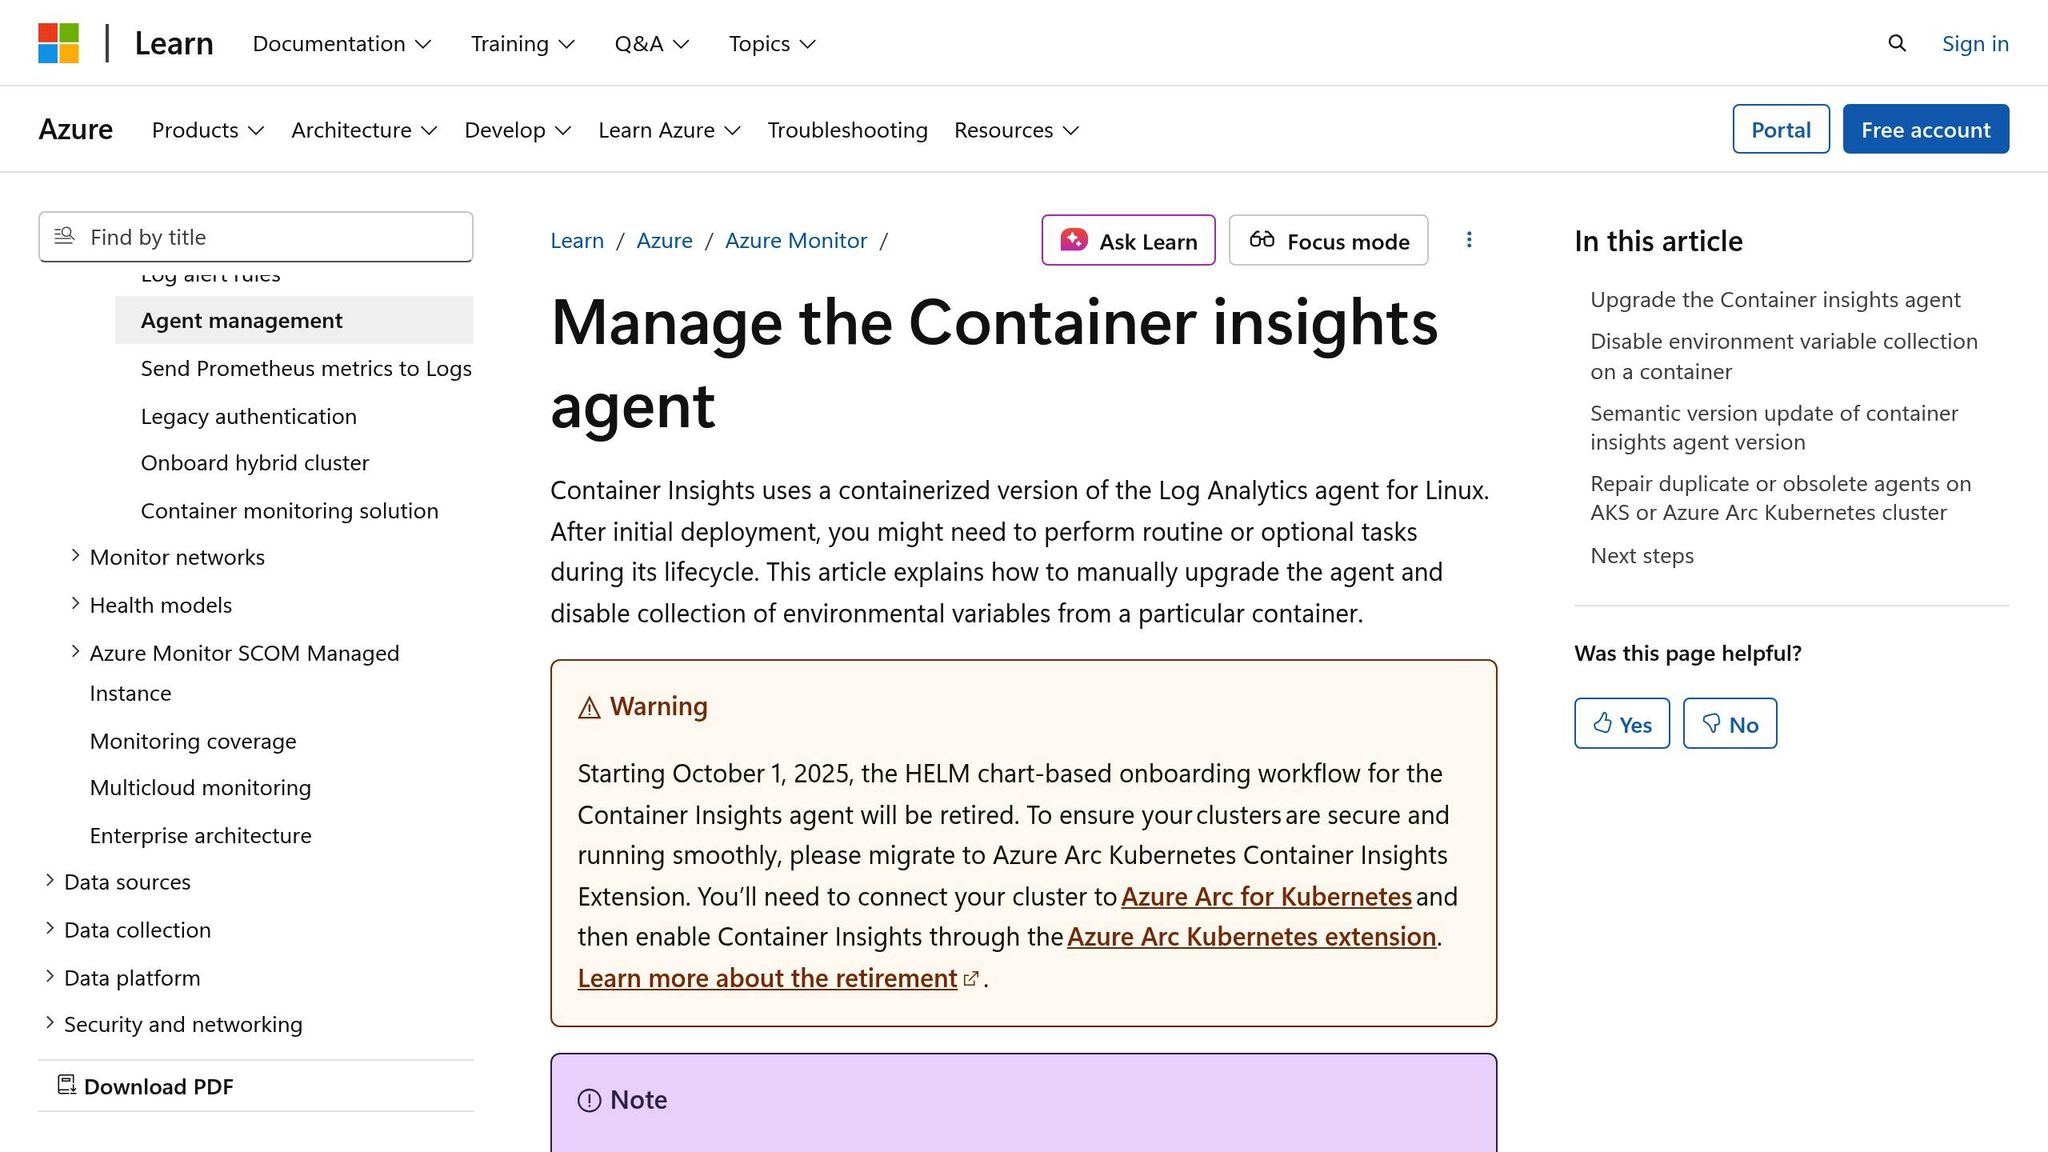
Container Insights is Azure's built-in monitoring tool designed to keep an eye on containers, pods, and Kubernetes clusters in Azure Kubernetes Service (AKS) and other container environments. It offers real-time insights into container performance, health, and resource use - making it a go-to solution for teams managing microservices or cloud-native applications.
Monitoring Across Infrastructure and Applications
Container Insights zeroes in on container-specific metrics, providing detailed monitoring across various layers of your setup. At the infrastructure level, it tracks key stats like node health, CPU usage, memory consumption, and disk I/O, giving you a clear picture of hardware performance and resource limits. At the container level, it keeps tabs on individual container performance, resource allocation, and operational status to help identify components that may be overloading the system. Pod-level metrics offer a closer look at how application instances handle different workloads, while a cluster-level overview highlights the overall health and performance of your Kubernetes environment.
How It Collects Data: Automatic, Agent-Based Approach
To simplify monitoring, Container Insights uses a containerized agent deployed directly to your Kubernetes clusters. This agent automates data collection, so there’s no need for manual SDK setups. It gathers metrics from sources like the Kubernetes API server, kubelet, and container runtime, supporting both push and pull methods to match different architecture needs. All this data is stored in a time-series database, which is optimized for analyzing time-stamped information. This setup not only speeds up the detection of performance issues but also helps with effective capacity planning.
Alerts and Troubleshooting Made Easy
With its real-time metric collection, Container Insights lets you set up smart alerts that use dynamic thresholds, adjusting automatically based on usage patterns. These alerts can notify you before resources hit their limits, giving you a chance to address issues before they escalate. By combining metrics with diagnostic logs, the platform makes it easier to identify root causes - whether it’s a container consuming too much memory or a pod failing to start - making troubleshooting faster and more efficient.
Seamless Integration with Azure and Beyond
Container Insights works seamlessly with Azure's ecosystem, supporting open-source monitoring tools and standards. It integrates with Azure Logic Apps to automate responses to detected issues and uses Azure RBAC to enforce role-based access, ensuring team members only see data they need. For teams already using tools like Prometheus and Grafana, Container Insights offers smooth integration. Plus, its ability to monitor multiple Kubernetes clusters from a single interface provides a unified view across your entire infrastructure stack.
sbb-itb-79ce429
5. AppStream Studio

After diving into native monitoring tools, the next step often requires advanced expertise to refine and elevate system performance. This is where AppStream Studio steps in, offering a hands-on approach to optimization that goes beyond just monitoring. Instead of focusing solely on real-time tracking, AppStream Studio collaborates with mid-market organizations to reimagine Azure architectures, aiming for improved performance and tighter compliance.
Monitoring Scope: Application and Infrastructure
AppStream Studio takes a comprehensive look at the entire Microsoft stack - Azure, .NET, and SQL - conducting deep architectural reviews. Their engineering teams dig into resource usage, integration points, and data flows to uncover optimization opportunities that automated tools might miss. This approach is especially beneficial for industries like financial services, healthcare, private equity, and construction, where performance upgrades must also meet strict security and audit requirements from the outset.
How Data Drives Optimization
Using data from Azure Monitor, Application Insights, and Azure Log Analytics, AppStream Studio takes a targeted approach to modernization. This can include API redesigns or unifying fragmented data systems. Their project-based model, supported by dedicated engineering teams, delivers measurable results in weeks - not months - making it an appealing choice for mid-sized companies looking for efficient cloud optimization.
Seamless Azure Integration
Designed specifically for the Microsoft ecosystem, AppStream Studio integrates deeply with Azure through native APIs and AI-powered tools. Their services cover a range of needs, from Azure cloud modernization and API/event-driven architectures to enterprise knowledge platforms and AI-driven automation. This ensures every optimization aligns seamlessly with Azure's capabilities, from cloud configurations to database queries.
Strategic Optimization and Diagnostics
While AppStream Studio isn’t a continuous alerting tool, it excels at providing strategic recommendations that enhance diagnostic processes and prevent future issues. Their AI-driven automation validates improvements with tangible metrics, such as reduced CPU usage, lower latency, and quicker deployment timelines. Organizations are encouraged to track both business outcomes - like faster time-to-market and lower cost per feature - and technical metrics, including CPU and memory usage, latency, throughput, and API response times. This dual focus ensures both technical and business goals are met effectively.
6. Azure Advisor
Azure Advisor is a built-in tool that provides recommendations to enhance the performance, reduce costs, and strengthen the security of your Azure environment. Unlike real-time monitoring tools, it takes a broader, strategic view of your Azure setup, helping you identify configuration issues and potential optimizations that daily monitoring might overlook.
Monitoring Scope: Application and Infrastructure
Azure Advisor examines both the application and infrastructure layers, analyzing resource configurations, usage patterns, and deployment practices. It identifies inefficiencies like oversized virtual machines (VMs), underutilized resources, or suboptimal settings that could hinder performance. For example, if a VM consistently runs at low CPU usage, Azure Advisor will suggest downsizing to a smaller SKU. These recommendations ensure your environment remains efficient, avoiding unnecessary costs and performance bottlenecks. By complementing the real-time monitoring of other Azure tools, Azure Advisor offers both immediate fixes and long-term optimization strategies.
Data Collection Method: Automatic
Azure Advisor simplifies the data collection process by working automatically - no setup, SDKs, agents, or additional instrumentation are required. It pulls data directly from Azure Resource Manager APIs, Azure Monitor metrics, and your subscription's configuration history.
This hands-off approach means Azure Advisor begins delivering insights as soon as it’s enabled. It continuously monitors your environment, updating its recommendations based on changes in usage patterns and configurations. This makes it an easy way to identify optimization opportunities without adding complexity to your infrastructure.
Integration with Azure Ecosystem
Azure Advisor integrates seamlessly into the Azure portal, where its recommendations are displayed alongside other management and monitoring tools. While tools like Azure Monitor provide real-time metrics, Azure Advisor translates this data into actionable suggestions. You can also export these recommendations via APIs to incorporate them into existing workflows, automation systems, or third-party tools.
For ongoing optimization, you can automate Azure Advisor recommendations using Azure Automation and Logic Apps. This allows you to streamline improvements as part of your deployment lifecycle, with options to include approval processes to prevent unintended changes.
Alerting and Diagnostic Capabilities
Although Azure Advisor isn’t designed for real-time alerts like Azure Monitor, it offers valuable diagnostic insights through its recommendation engine and detailed analysis reports. You can configure email notifications to alert your team when new recommendations are available.
Each recommendation includes detailed information, such as the metrics that triggered it, historical data, and the potential impact of implementing the change. This level of detail helps teams understand the root causes of issues and decide which recommendations to prioritize.
Azure Advisor organizes its recommendations into five categories: Reliability, Security, Performance, Operational Excellence, and Cost Optimization. For performance tuning, it often highlights areas like compute right-sizing, database optimization, and network adjustments - changes that can significantly improve workload efficiency. By prioritizing recommendations based on impact, Azure Advisor ensures you focus on optimizations that will deliver the greatest performance gains.
Tool Comparison Table
When deciding on the right tool, consider your workload, budget, and technical environment. Each tool brings its own strengths, from seamless Azure integration to advanced analytics and AI-driven anomaly detection. Below is a breakdown of how these tools differ in their core features and use cases.
Monitoring Scope
- Azure Monitor: Tracks Azure resources like virtual machines (VMs), containers, and databases.
- Application Insights: Focuses on application performance monitoring (APM) with features like distributed tracing and live metrics streaming.
- Azure Log Analytics: Acts as a centralized workspace for logs and metrics from both IaaS and PaaS resources, offering deep analysis across your infrastructure.
- Container Insights: Designed for containerized workloads, providing pod-level visibility for Kubernetes clusters.
- AppStream Studio: Specializes in Azure modernization, combining data, AI, and engineering expertise to optimize workloads in a matter of weeks.
- Azure Advisor: Analyzes application and infrastructure configurations, offering strategic insights to improve performance, security, and cost efficiency.
Data Collection Methods
- Azure Monitor: Gathers metrics, logs, and performance data from Azure resources and applications.
- Application Insights: Requires SDK integration or auto-instrumentation for detailed telemetry.
- Azure Log Analytics: Aggregates data from multiple sources into a unified workspace for analysis.
- AppStream Studio: Implements tailored data collection strategies to suit your Azure environment.
- Azure Advisor: Works automatically, pulling data from Azure Resource Manager APIs and Azure Monitor metrics without extra setup.
Alerting Capabilities
- Azure Monitor: Offers dynamic threshold alerts and ML-based anomaly detection, with automation through Azure Logic Apps.
- Application Insights: Provides real-time alerts on application performance and availability.
- Azure Log Analytics: Allows custom alert rules based on log queries and metric thresholds.
- Container Insights: Issues alerts for container health and resource usage.
- AppStream Studio: Uses AI-driven automation to proactively address performance issues.
- Azure Advisor: Sends email notifications with detailed recommendations but lacks real-time alerting.
Visualization Options
- Azure Monitor: Supports customizable dashboards and integrates with tools like Prometheus and Grafana.
- Application Insights: Offers tailored dashboards for application-specific metrics and insights.
- Azure Log Analytics: Features query-driven visualizations through Azure Monitor workbooks.
- Container Insights: Provides container-specific dashboards with detailed pod-level metrics.
- AppStream Studio: Delivers custom dashboards and reports aligned with business needs.
- Azure Advisor: Displays recommendations in the Azure portal, organized by categories like Reliability, Security, Performance, and Cost Optimization.
Here's a consolidated table for quick comparison:
| Tool | Monitoring Scope | Data Collection | Alerting | Visualization | Best Use Case |
|---|---|---|---|---|---|
| Azure Monitor | Infrastructure, VMs, containers, databases | Agent-based & agentless | Smart alerts with dynamic thresholds, ML-based anomaly detection | Customizable dashboards; Prometheus/Grafana integration | Comprehensive monitoring within the Microsoft ecosystem |
| Application Insights | Application performance and user experience | SDK integration or auto-instrumentation | Real-time performance alerts and availability monitoring | Customizable APM dashboards; distributed tracing views | Deep application-level monitoring and distributed tracing |
| Azure Log Analytics | Centralized logs and metrics from IaaS/PaaS | Multiple source integration | Custom alert rules based on log queries and metric thresholds | Azure Monitor workbooks; query-based visualizations | Centralized log aggregation and in-depth analysis |
| Container Insights | Containers and Kubernetes clusters | Agent-based container collection | Alerts on container health and resource utilization | Container-specific dashboards; pod-level visibility | Monitoring containerized workloads on Azure Kubernetes Service |
| AppStream Studio | Full-stack Azure modernization | Custom implementation strategies | AI-driven automation with proactive monitoring | Custom dashboards | Modernization projects requiring expert engineering and measurable outcomes |
| Azure Advisor | Strategic configuration and optimization | Automatic via Azure Resource Manager APIs | Email notifications for new recommendations | Portal-based recommendation interface | Strategic, long-term optimization guidance |
Pricing Models
Pricing varies across these tools:
- Azure Monitor: Free basic logs; pay-as-you-go for advanced usage.
- Application Insights: Charges based on data ingestion volume.
- Azure Log Analytics: Costs depend on data ingestion and retention periods.
- Container Insights: Aligns with Azure Monitor's consumption model.
- AppStream Studio: Offers custom pricing tailored to your project needs.
- Azure Advisor: Included at no extra cost with your Azure subscription.
Native tools like Azure Monitor and Azure Advisor integrate seamlessly with Azure resources, keeping costs low. Tools like Application Insights and Container Insights justify their consumption-based pricing with specialized features. Azure Log Analytics simplifies troubleshooting with centralized data, while AppStream Studio delivers faster results through expert-led modernization.
For hybrid or multi-cloud setups, Azure Monitor supports monitoring across Azure, on-premises, and other platforms with proper agent deployment. Application Insights can monitor applications regardless of hosting location, while Azure Log Analytics centralizes data from diverse sources. Container Insights works well with Azure Kubernetes Service and Azure Arc-enabled Kubernetes. AppStream Studio focuses on Azure-specific modernization, offering integration-friendly features like API and event-driven architecture. Azure Advisor, meanwhile, provides strategic insights for optimizing Azure resources.
Choose the tool that aligns with your needs - whether it's Azure Monitor for broad infrastructure monitoring, Application Insights for detailed application tracking, Azure Log Analytics for centralized analysis, Container Insights for Kubernetes visibility, AppStream Studio for quick modernization, or Azure Advisor for strategic recommendations. These tools can be combined to create a tailored performance optimization strategy.
Conclusion
Getting the best performance out of your Azure workloads means using the right mix of monitoring and diagnostic tools. Azure Monitor is your go-to for keeping an eye on infrastructure, tracking everything from virtual machines to containers and databases. For teams focused on application health and user experience, Application Insights offers detailed application-level monitoring, including distributed tracing and real-time performance alerts.
When it comes to managing logs, Azure Log Analytics shines by pulling data from multiple sources into one centralized workspace, allowing for powerful, query-based analysis across your infrastructure. For Kubernetes environments, Container Insights provides pod-level visibility, tackling the specific challenges of containerized workloads. Adding another layer of value, Azure Advisor analyzes your configurations and offers tailored recommendations to improve performance, security, and cost efficiency - all without extra charges.
For those looking to go beyond Azure’s native tools, expert-led solutions can bring substantial benefits. Take AppStream Studio, for example. It combines senior engineering expertise with Azure modernization services to deliver measurable results in weeks. By unifying data, integrating APIs, and rolling out production-level AI, it’s especially valuable for industries like financial services and healthcare, where security and compliance are critical.
Choosing the right tools depends on your priorities. Use Azure Monitor for infrastructure metrics and Application Insights to track application performance. If you’re managing Kubernetes clusters, Container Insights is indispensable for its specialized monitoring capabilities.
A well-rounded strategy balances cost control with full visibility into metrics, logs, and traces. Native Azure tools are designed to work seamlessly together, keeping costs predictable. Meanwhile, expert services like AppStream Studio can dramatically shorten implementation timelines, taking you from months to weeks.
Ultimately, aligning the tools you choose with your workload architecture and team expertise is key. If you’re new to monitoring, tools with simplified interfaces and automated anomaly detection can ease the learning curve. For hybrid environments, cross-platform visibility is a must. Together, these tools and strategies enable faster recovery times and proactive performance improvements, setting you up for long-term success in Azure.
FAQs
How can using multiple Azure tools improve workload performance tuning?
Combining various Azure tools can greatly improve workload performance tuning by offering a detailed view of your systems and supporting informed decision-making. For instance, Azure Monitor provides real-time monitoring and insights into resource usage, while Application Insights zeroes in on application performance and user behavior. When used together, these tools can pinpoint bottlenecks, track critical metrics, and fine-tune resources effectively.
Using these tools side by side allows you to tackle performance challenges proactively, ensure scalability, and maintain reliable availability for your workloads. For businesses aiming to speed up their Azure modernization efforts, platforms like AppStream can simplify the process by integrating data, AI, and cloud solutions into a cohesive approach, delivering actionable results with efficiency.
What are the key advantages of using Application Insights with Azure Monitor to optimize application performance?
Using Application Insights with Azure Monitor creates a powerful duo for keeping tabs on your applications and improving their performance. Azure Monitor handles system-level data like metrics, logs, and diagnostics, while Application Insights dives deeper into your application, tracking things like request performance, dependencies, and user behavior.
When combined, these tools make it easier to pinpoint performance issues, catch anomalies early, and gather meaningful insights to boost your app's reliability and speed. This setup ensures smoother operations, delivers a better experience for users, and helps resolve issues more quickly.
How does Azure Advisor work with real-time monitoring tools to identify long-term performance improvements?
Azure Advisor works hand-in-hand with real-time monitoring tools like Azure Monitor to give you tailored recommendations for your Azure workloads. While Azure Monitor zeroes in on live data and immediate performance metrics, Azure Advisor takes a broader view by analyzing historical trends and usage patterns. This allows it to pinpoint areas where you can reduce costs, improve security, and fine-tune your overall setup.
By using Azure Advisor alongside real-time monitoring, you can tackle short-term performance issues while also planning strategic improvements for the future. This combination keeps your Azure environment running efficiently and aligned with your business objectives.