Azure Monitor: Track Idle Resource Usage
Azure Monitor can help you cut unnecessary Azure costs by identifying resources that sit idle or are underutilized. Idle resources - like virtual machines (VMs) with low CPU usage, databases with minimal activity, or unattached disks - can silently inflate your Azure bill by hundreds or even thousands of dollars monthly. This guide explains how to use Azure Monitor to track idle resources, set alerts, and automate cleanups.
Key Takeaways:
- Idle Resources Defined: These are Azure services running with little to no usage over time, such as VMs with less than 5% CPU utilization for 30 days or unused public IPs.
- Metrics to Watch: CPU usage, memory consumption, disk IOPS, network traffic, and database activity are critical for spotting idle resources.
- Cost Impact: Studies estimate 20–30% of cloud spending is wasted on idle resources, often amounting to tens of thousands of dollars annually for mid-sized businesses.
- Tools: Use Azure Monitor's metrics, Log Analytics (KQL), and dashboards to track and analyze resource utilization.
- Action Steps: Resize, scale down, or delete idle resources. Automate cleanup tasks with tools like Azure Automation and Logic Apps.
By following these steps, you can optimize your Azure environment, simplify resource management, and reduce costs effectively.
Azure Cost Savings: Find and Centralize Unused or Orphan Resources with Azure Monitor Workbook
What Are Idle Resources in Azure
Idle resources in Azure refer to services that are running and generating costs but provide little to no value over a prolonged period. These aren't temporary situations or scheduled downtimes - they're resources that show consistently low usage without supporting any meaningful workload. For example, a virtual machine (VM) operating at just 2–3% CPU utilization for an entire month after a project ends is a clear case of wasted spending. This is different from a VM used occasionally for critical tasks like batch processing.
Some common examples include VMs created for testing or proof-of-concept work that were never shut down, App Service Plans running only a single low-traffic staging slot while being billed for a higher-tier capacity, or Azure SQL databases that see only a few connections per week because the application tied to them has been retired. Other examples include unattached managed disks left behind after VMs are deleted, unused public IP addresses linked to decommissioned resources, and load balancers or NAT gateways that no longer serve any active workloads.
The challenge lies in distinguishing genuinely idle resources from those intentionally overprovisioned for specific purposes, like disaster recovery or compliance. For instance, a VM reserved for failover might show low utilization but still serves a critical function. Idle resources, on the other hand, typically lack any documented purpose - they're often the result of incomplete cleanup, abandoned experiments, or forgotten workloads that were migrated elsewhere. Identifying these idle assets is essential, as even small inefficiencies can snowball into significant cost increases.
How Idle Resources Increase Costs
Idle resources are a hidden drain on budgets, quietly adding up across subscriptions and resource groups. A few forgotten VMs, databases, or networking components might seem trivial individually, but together they can rack up several hundred dollars per month without delivering any value. For mid-sized organizations managing their budgets in U.S. dollars, these overlooked expenses can total tens of thousands annually - money better spent on initiatives like AI development, infrastructure upgrades, or modernization efforts.
The financial impact isn't limited to direct costs. Idle resources complicate your Azure environment, making it harder to distinguish essential assets from expendable ones during audits or capacity planning. When finance teams review invoices, they often encounter charges for services no one can account for, which undermines confidence in cloud management practices. Chargeback models can also falter when departments are billed for resources they aren't actively using, leading to disputes and time-consuming manual reconciliations.
Translating idle resource usage into dollar amounts helps bridge the gap between technical teams and leadership. Instead of reporting low CPU utilization, you can highlight that three idle databases are costing $1,200 per month and recommend reallocating those funds to more pressing needs. This financial framing makes it easier to justify cleanup efforts and prioritize cost-saving measures. It also underscores the importance of tools like Azure Monitor in optimizing cloud spending.
Metrics for Finding Idle Resources
Azure Monitor provides key metrics to help identify idle resources and eliminate unnecessary costs. CPU usage is often the most telling indicator - a VM running at just 2–5% CPU for 30 consecutive days is likely idle unless it’s specifically reserved for failover or burst scenarios. Network in/out metrics can also reveal inactivity; minimal data transfer over weeks suggests a resource isn't actively communicating with other services or users.
Other metrics, like memory usage and disk IOPS, offer additional insights. For example, a database with minimal I/O activity and flat memory usage over several weeks is likely idle, especially if no maintenance or reporting tasks are expected. Similarly, transaction counts and blob access patterns for storage accounts can signal inactivity; objects untouched for 90 days or more may be candidates for archival or deletion.
Azure SQL databases provide metrics such as DTU or vCore usage and active connection counts. A database showing near-zero connections during business hours, coupled with minimal DTU consumption, is a strong indicator of idleness. For App Service Plans, HTTP request counts and response times can highlight inactivity - a plan with almost no incoming requests over a month likely hosts stopped or removed apps.
Networking resources also have telltale signs of idleness. Metrics like load balancer throughput and public IP association status can reveal whether these components are actively routing traffic. For example, an unattached public IP or a load balancer with no backend connections is incurring costs without serving any purpose. By analyzing these metrics across different resource types, you can pinpoint idle capacity and take targeted steps to clean up your environment, reducing unnecessary expenses.
Setting Up Azure Monitor for Idle Resource Tracking
To manage costs effectively, Azure Monitor needs to be configured to collect the right telemetry. This involves meeting prerequisites, setting permissions, and enabling diagnostic settings across your Azure environment. While the setup may take some effort initially, it lays a solid foundation for identifying idle resources and automating cost-saving measures.
Requirements for Using Azure Monitor
To get started, you’ll need an active Azure subscription, proper permissions, a Log Analytics workspace, and a clear understanding of which services support Azure Monitor metrics and logs.
Role-based access control (RBAC) is crucial for managing configurations. The Monitoring Contributor role is required at the subscription or resource group level to set up diagnostic settings, link Log Analytics workspaces, and manage alert rules. For those who only need to view reports and dashboards, the Monitoring Reader role provides read-only access.
A Log Analytics workspace is essential for in-depth analysis. Azure Monitor collects platform metrics for most services at no extra cost, but more detailed insights often require additional data stored in this workspace. You can query this data using Kusto Query Language (KQL). For optimal performance, it’s recommended to place the workspace in the same region as the resources being monitored to minimize latency and avoid cross-region data transfer costs.
When deciding between a centralized workspace or multiple workspaces for different environments (e.g., production, development, staging), consider your organization’s needs. A centralized workspace simplifies cross-subscription queries and dashboards, while multiple workspaces offer better access control and cost separation. For many mid-sized organizations, maintaining separate workspaces for production and non-production environments strikes a good balance.
Data retention policies also play a role in cost and analysis depth. Retaining data for 30–90 days is a practical range for most scenarios.
Not all Azure services provide the same level of monitoring. Core resources like virtual machines, App Services, Azure SQL databases, storage accounts, and AKS clusters offer detailed metrics and logs. However, some specialized or preview services may have limited telemetry. Before enabling idle resource tracking, confirm that the services you’re monitoring support the necessary metrics (e.g., CPU usage, network activity, or transaction counts). Check Microsoft Learn documentation for specifics.
Tagging resources isn’t mandatory, but it makes idle resource analysis much more actionable. Tags like environment (Prod, Dev, Test), application name, cost center, and owner help you filter dashboards and queries by business unit or workload. For example, if you identify an idle virtual machine, tags can quickly reveal whether it’s part of an active project or an abandoned experiment. This practice also simplifies integration with cost management tools and helps ensure the right teams are involved in decision-making.
Once permissions and workspaces are ready, you can move on to configuring diagnostic settings for precise metric collection.
Configuring Azure Monitor to Collect Idle Resource Metrics
With prerequisites in place, the next step is enabling diagnostic settings for the resources you want to monitor. This involves selecting each resource, configuring its settings, and routing telemetry to your Log Analytics workspace.
Start with Activity Logs, which capture control-plane operations like starting, stopping, or resizing resources. These logs are stored for 90 days by default at no extra cost. To enable long-term analysis, export these logs to your Log Analytics workspace. In the Azure portal, go to Activity Log, select Export Activity Logs, and create a diagnostic setting to send logs to the workspace. Since this applies at the subscription level, you only need to configure it once per subscription. These logs help identify resources that have been idle for extended periods versus those used sporadically for tasks like batch jobs.
For virtual machines, basic metrics like CPU and network usage are collected automatically, but deeper insights require the Azure Monitor Agent (AMA) and VM insights. To enable these, navigate to a VM in the Azure portal, go to the Monitoring section, and activate VM insights. This installs the Azure Monitor Agent and configures performance counters (e.g., CPU, memory, disk IOPS, network in/out) to be sent to the InsightsMetrics table in your workspace. These metrics, collected at intervals like 60 seconds, are critical for detecting cost-saving opportunities. VM insights also gather dependency data, such as running processes and network connections, which can reveal application-level idleness even when CPU usage is low.
For Azure SQL databases and App Service Plans, you’ll need to explicitly enable diagnostic settings. For a SQL database, open the resource in the portal, go to Diagnostic settings, and add a new setting. Select metrics like Basic, InstanceAndAppAdvanced, or WorkloadManagement, and include logs such as QueryStoreRuntimeStatistics and Errors. Route these to your Log Analytics workspace to capture key signals like utilization metrics, active connections, and query execution patterns. For App Service Plans, enable metrics such as HTTP requests, response times, and CPU/memory usage to identify plans with minimal traffic.
Storage accounts require diagnostic settings for each service type (e.g., blobs, files, tables, queues). For example, to monitor blob activity, navigate to Diagnostic settings for the storage account, create a setting for blob, and enable metrics like Transaction counts. Route these logs to your Log Analytics workspace and repeat for other service types as needed.
For networking resources like load balancers, public IPs, and NAT gateways, enable diagnostic settings to capture metrics such as throughput, packet counts, and SNAT connection counts. Resources with near-zero activity, like unattached public IPs or idle load balancers, can then be flagged for cleanup.
After enabling diagnostic settings, verify that data is flowing correctly. Use Metrics Explorer in the Azure portal to check for recent data points on key metrics like CPU usage or transaction counts. In Log Analytics, run simple KQL queries like Perf | where TimeGenerated > ago(1h) | take 10 or AzureMetrics | where TimeGenerated > ago(1h) | take 10 to confirm telemetry is arriving. Common issues include targeting the wrong workspace, missing metric categories, or insufficient permissions preventing data collection.
To streamline configurations across multiple subscriptions or resource groups, consider using Azure Policy. For instance, you can enforce a rule requiring all virtual machines to send performance metrics to a designated workspace. This approach ensures consistency and reduces manual setup, especially in environments with large numbers of resources.
For organizations managing complex Azure environments, setting up Azure Monitor for idle tracking can be challenging. This is where modernization specialists like AppStream Studio can help. AppStream works with mid-sized businesses to accelerate their Azure adoption, offering services like standardized monitoring patterns, unified data integration, and production-ready dashboards. Their expertise enables faster implementation of tracking solutions, helping you surface idle resources and automate remediation workflows efficiently.
With these configurations in place, you’re ready to monitor idle resources and optimize costs effectively.
Monitoring Idle Resources with Metrics and Alerts
Once you've gathered telemetry data, the next step is to define what "idle" means for your resources and set up alerts to catch underutilized ones. This method builds on earlier configurations, helping you manage idle resources proactively. It involves setting clear thresholds for idleness, configuring alerts to notify you when those thresholds are crossed, and creating dashboards to provide a comprehensive view of underutilized resources in your Azure environment.
Setting Idle Thresholds for Different Resource Types
Not all resources go idle in the same way. For instance, a virtual machine (VM) might show low CPU usage for days, while a database could have minimal query activity despite steady DTU consumption. Defining realistic thresholds for each resource type ensures you can spot inefficiencies without being overwhelmed by false alarms.
- Virtual Machines (VMs): A VM averaging less than 5% CPU usage, with minimal disk IOPS and network activity for 7–14 days, is likely idle. For always-on production workloads, set more conservative thresholds to avoid unnecessary alerts during predictable low-activity periods. In development or test environments, you can apply stricter criteria, such as flagging VMs with near-zero activity outside business hours.
- App Service Plans: Look for consistently low CPU usage (e.g., below 10%), minimal HTTP requests, and low memory usage. If an App Service Plan processes only a handful of requests per hour over a week or more, it might be oversized, potentially signaling opportunities for consolidation.
- Databases: Azure SQL databases with DTU usage under 20% and low query counts over several weeks could be downsized or shifted to a serverless model. For workloads with occasional spikes, like batch reporting, ensure your thresholds account for these expected activity windows.
- Storage Accounts: Monitor metrics like transaction counts and data egress over 30–90 days. If transactions remain near zero outside of scheduled processes, consider moving the data to a colder storage tier or even deleting it.
- Batch Jobs and Scheduled Workloads: Standard idle thresholds might not apply to workloads that run infrequently. Use tags like "Batch" or "MonthlyJob" or create schedule-aware rules to exclude these resources from idle alerts.
Creating Alerts for Early Warnings
Once you've established thresholds, turn them into actionable alerts. Instead of manually checking dashboards, use Azure Monitor to notify your team - or trigger automated actions - when resources meet idle conditions.
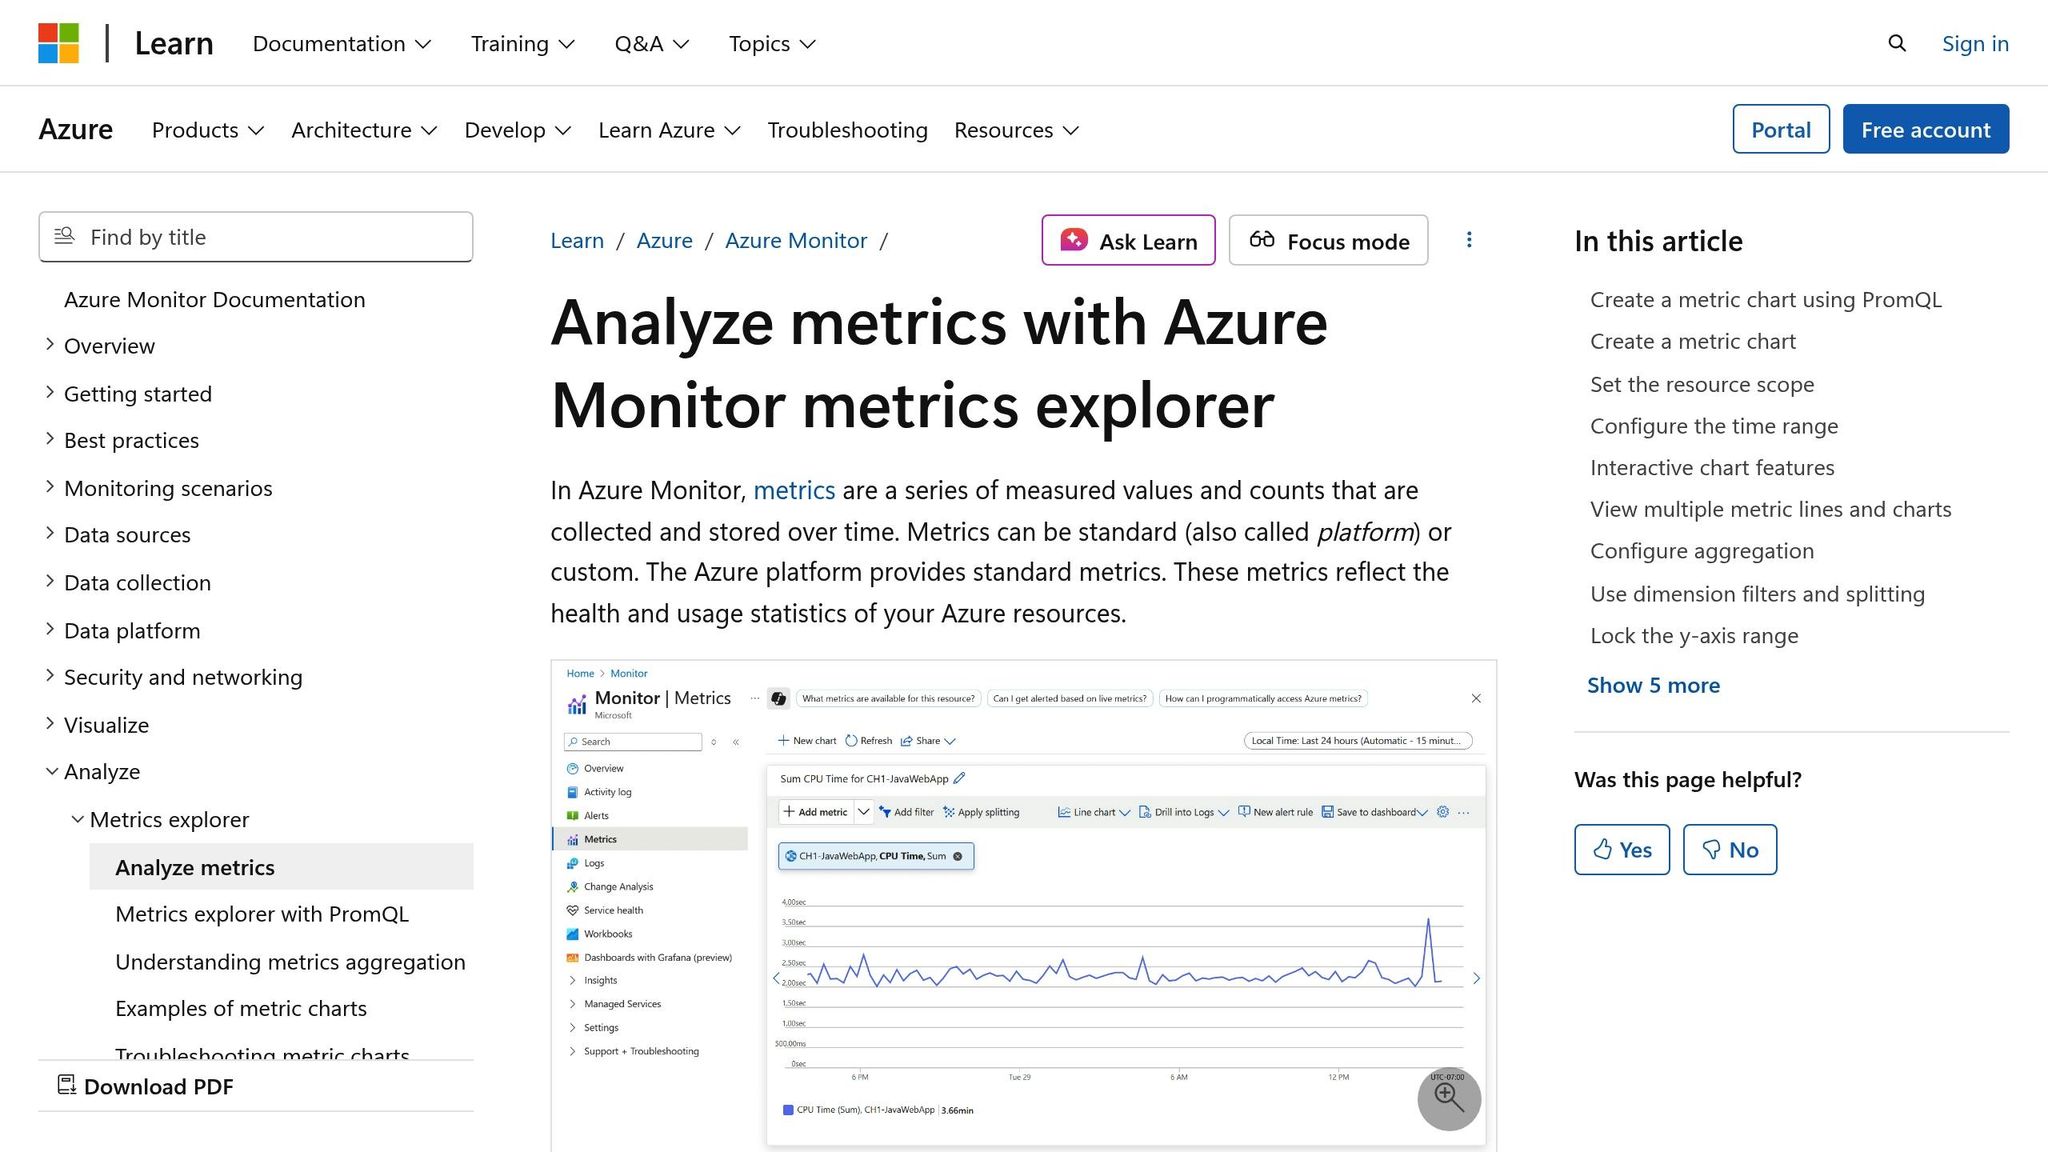
To set up alerts, open the resource's Metrics view in the Azure portal. For example, if you're tracking VMs with low CPU usage, plot the Percentage CPU metric over the last 30 days. If the data consistently stays below 5%, you’ve identified a baseline for idleness.
Next, click New alert rule in the Metrics view. Select the subscription and scope, then choose the relevant metric, such as Percentage CPU. Define the condition, like "CPU Percentage < 5% for the last 24 hours", to ensure the alert fires only when low utilization persists, minimizing false positives from temporary dips.
Action groups determine how and where alerts are sent. For U.S.-based teams, typical channels include email, SMS, push notifications, and webhooks integrated with tools like Microsoft Teams, PagerDuty, or ServiceNow. You can also configure webhooks to trigger automated workflows using Logic Apps or Azure Functions. For example, automation could tag idle resources, stop VMs, or scale down App Service Plans.
A tiered alerting strategy works well to catch trends early. For instance:
- Warning alerts: Trigger when CPU usage is below 10% for 3 days, prompting a review or tagging.
- Critical alerts: Fire when CPU usage drops below 5% for 7 days, signaling the need for action like resizing or decommissioning.
This logic can be applied to other resources too. For example, database alerts could trigger when DTU usage falls below 15% for 7 days with minimal connections, while storage alerts might activate if transactions drop below 100 per day for 30 days.
Many organizations have identified oversized databases and underused VMs through such alerts. Once flagged, these resources can be downsized, shut down during off-hours, or moved to more cost-effective configurations, leading to noticeable savings.
Automation can streamline this process further. By routing Azure Monitor alerts to Logic Apps or automation runbooks, you can evaluate additional context - like tags or business rules - before taking action. This approach enables non-disruptive workflows that can evolve into more automated cost-saving measures as your governance processes mature.
Building Dashboards to Track Idle Resources
Dashboards provide a consolidated view of idle resources, saving you from manually checking individual metrics. They help you visualize underutilized assets and monitor trends over time.
Start by creating a new dashboard in the Azure portal. Use Metrics Explorer to chart key signals, such as CPU usage, network activity, DTU usage, and transaction counts. Pin these visualizations to your dashboard for quick access. Combine time-series charts with top-N lists to identify the least-utilized resources at a glance.
You can filter data by subscription, resource group, environment, or owner. For databases, include charts for DTU or vCore utilization and connection counts. For storage accounts, track transaction counts and data egress. Pair these metrics with cost-related tiles from Azure Cost Management to highlight where reducing idle usage could save the most money.
Historical charts covering weeks or months can reveal patterns, such as end-of-month spikes or quarterly cycles. By overlaying business calendars or tags like "DR", "Compliance", or "Batch", you can determine if low utilization is expected or if a resource is genuinely unnecessary.
For a broader perspective, consider building a centralized view that aggregates idle resource data across all subscriptions. Azure Monitor Workbooks can provide advanced visualizations and filtering options, making it easier to track and act on idle resource trends.
Regularly updating your dashboards ensures they remain accurate and actionable, helping you stay on top of underutilized resources and optimize costs effectively.
sbb-itb-79ce429
Analyzing Idle Resources with Log Analytics and Workbooks
Building on the dashboards and alerts we've set up, let’s take a closer look at how Log Analytics and Workbooks can help you dig deeper into idle resource analysis. Dashboards provide a quick visual overview, but Log Analytics and Workbooks allow you to explore patterns, query across multiple subscriptions, and even calculate the costs of idle resources. This approach transforms data into actionable insights, helping you not only identify idle resources but also understand their financial impact. It’s a crucial step that complements the visual monitoring tools discussed earlier.
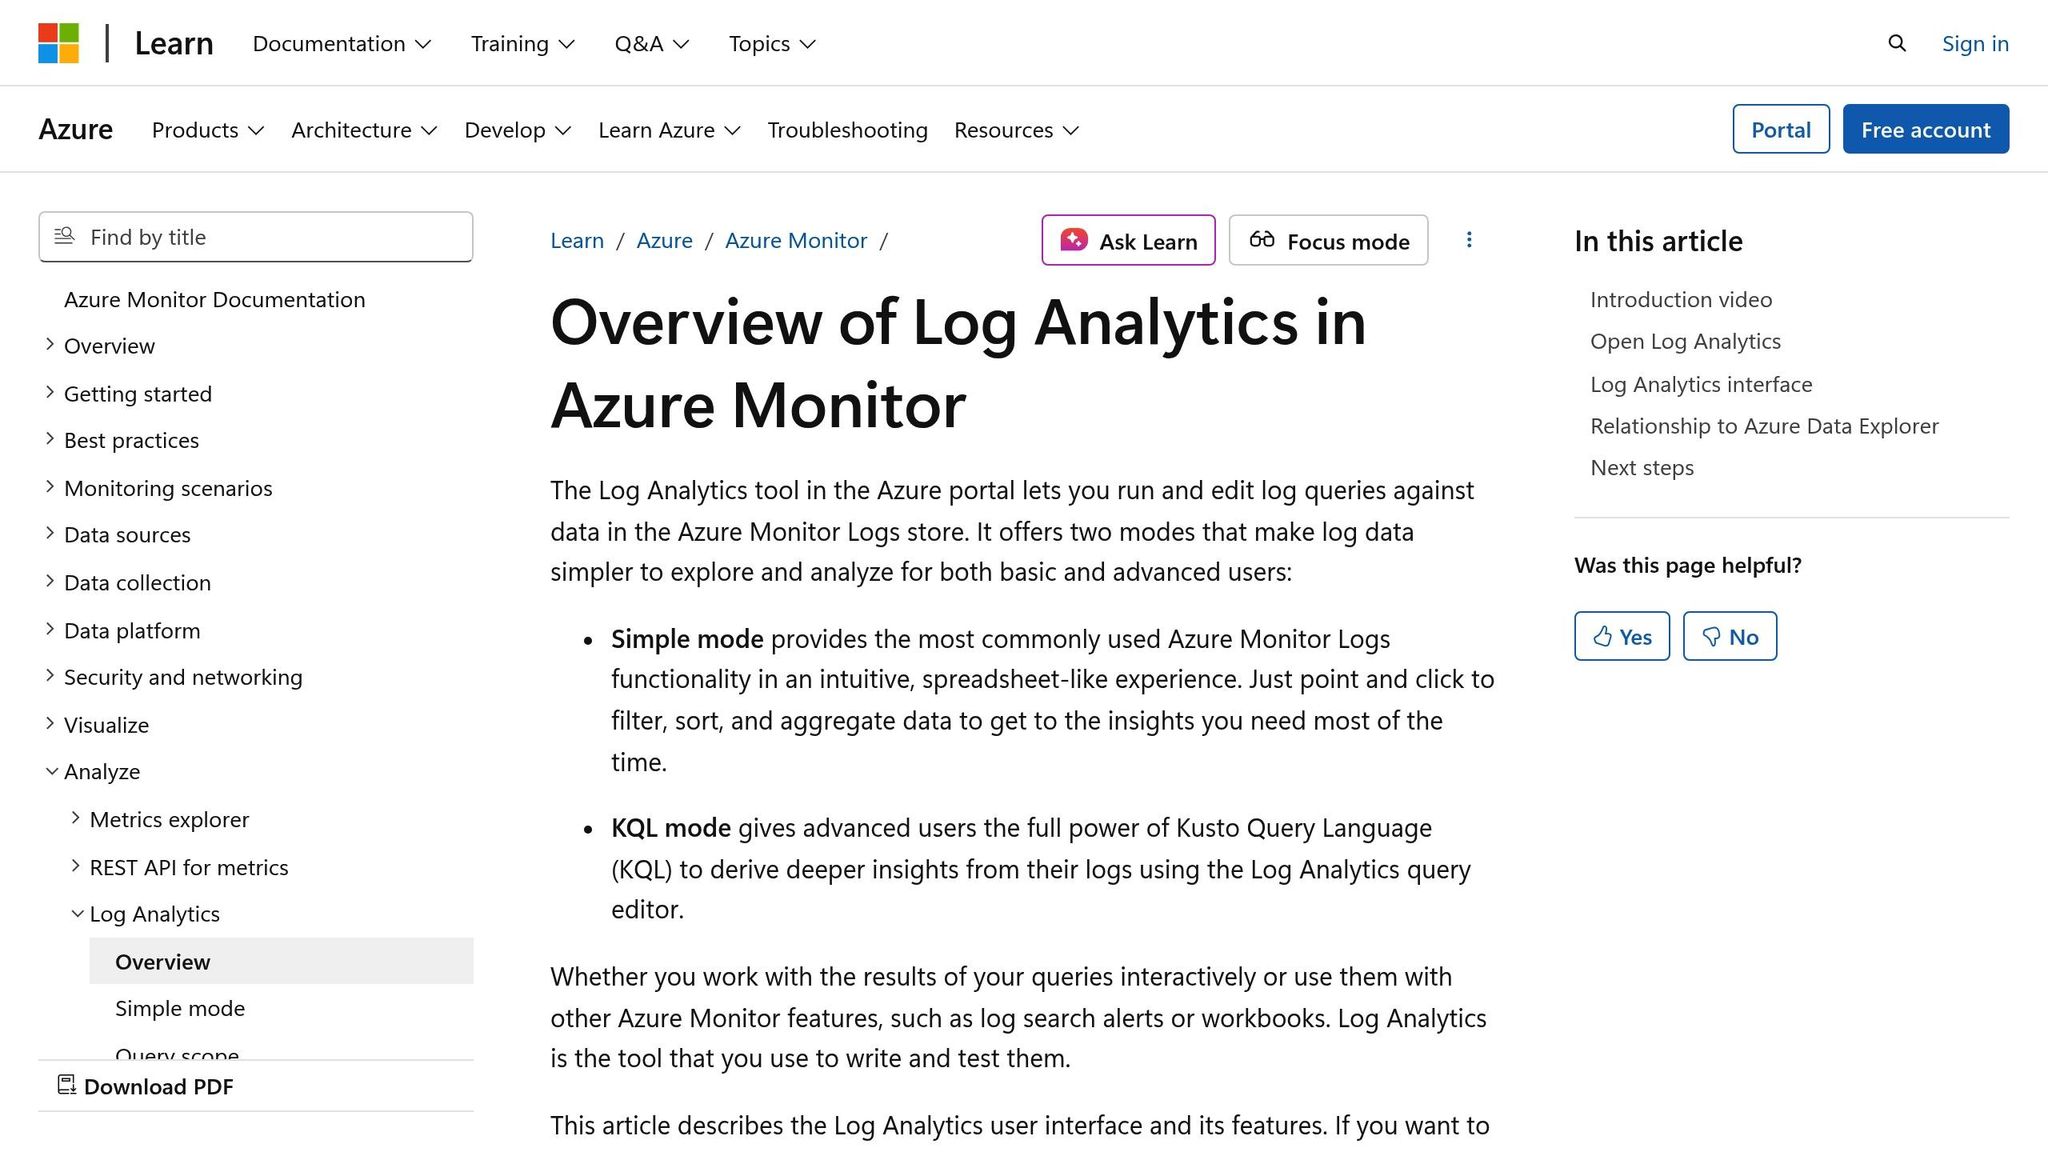
Log Analytics uses KQL (Kusto Query Language) to search and analyze metrics, logs, and inventory data across Azure. Workbooks build on this by adding interactive visualizations and cost estimates, creating reports that are useful for both technical teams and financial stakeholders. Together, they shift your process from reactive monitoring to a more systematic, repeatable analysis of idle resources.
Using KQL to Find Idle Resources
With KQL, you can analyze usage patterns over weeks or months, filter by thresholds, and group results by subscription, resource group, or tags. This is especially helpful when managing idle resources across dozens - or even hundreds - of subscriptions, where manual checks simply aren’t feasible.
For virtual machines (VMs), you can query the InsightsMetrics table, which tracks performance data collected by Azure Monitor Agent or VM Insights. For example, the following query identifies VMs with an average CPU utilization below 5% over the past 30 days:
InsightsMetrics
| where TimeGenerated > ago(30d)
| where Namespace == "Processor" and Name == "UtilizationPercentage"
| summarize AvgCPU = avg(Val) by Computer, _ResourceId
| where AvgCPU < 5
| project Computer, _ResourceId, AvgCPU
| order by AvgCPU asc
This query lists VMs with consistently low CPU usage, sorted in ascending order. You can expand it by joining with Resource Graph to include additional details like environment tags, owner, or cost center.
For databases, you can query tables like AzureDiagnostics to identify low DTU or vCore usage and minimal connection counts. Here’s an example:
AzureDiagnostics
| where ResourceProvider == "MICROSOFT.SQL"
| where TimeGenerated > ago(30d)
| where MetricName == "dtu_consumption_percent"
| summarize AvgDTU = avg(Average) by Resource, ResourceGroup
| where AvgDTU < 20
| project Resource, ResourceGroup, AvgDTU
| order by AvgDTU asc
This query works for Azure SQL databases but can be adjusted for other database types by tweaking the metric names and thresholds.
Storage accounts are another common source of idle capacity, often provisioned for projects that never take off or for data that’s no longer accessed. To detect these, you can track transaction counts over a 30- to 90-day period:
AzureMetrics
| where ResourceProvider == "MICROSOFT.STORAGE"
| where TimeGenerated > ago(90d)
| where MetricName == "Transactions"
| summarize TotalTransactions = sum(Total) by Resource, ResourceGroup
| where TotalTransactions < 100
| project Resource, ResourceGroup, TotalTransactions
| order by TotalTransactions asc
Storage accounts with fewer than 100 transactions over three months are likely candidates for archival, tier adjustments, or even deletion.
To identify orphaned or rarely used resources, you can combine utilization metrics with activity logs. For example, this query finds VMs that haven’t been started, stopped, or reconfigured in the past 30 days:
AzureActivity
| where TimeGenerated > ago(30d)
| where ResourceProvider == "Microsoft.Compute" and ResourceType == "virtualMachines"
| where OperationNameValue has_any ("start", "deallocate", "restart")
| summarize LastActivity = max(TimeGenerated) by Resource
| where LastActivity < ago(30d)
| project Resource, LastActivity
You can cross-check the results with CPU and network metrics to confirm whether these VMs are genuinely idle.
Creating Reports with Workbooks
Once you’ve identified idle resources using KQL, Workbooks can help you turn this data into actionable, interactive reports. Workbooks allow you to present your findings visually, combining charts, tables, and text. They’re particularly effective for sharing insights with finance teams or leadership, as you can layer cost estimates on top of usage data.
To create a workbook, go to Azure Monitor in the portal, navigate to Workbooks, and start with a blank template. Add parameter controls - such as dropdowns for subscription, time range, and environment tags - so users can easily filter the report.
Next, include a query step to display idle VMs. Use the earlier KQL example to pull data, then show the results in a table with columns for VM name, resource group, average CPU, and relevant tags (like owner). You can also add a summary tile that highlights the total number of idle VMs.
For cost savings, estimate potential reductions in USD. For instance, if a Standard_D4s_v3 VM costs about $0.192 per hour and runs continuously, it totals roughly $140 per month. Shutting down or resizing an idle VM could save most of that cost. To include actual cost data, combine pricing information with your idle-resource query:
let IdleVMs = InsightsMetrics
| where TimeGenerated > ago(30d)
| where Namespace == "Processor" and Name == "UtilizationPercentage"
| summarize AvgCPU = avg(Val) by _ResourceId
| where AvgCPU < 5;
AzureCostManagement
| where TimeGenerated > ago(30d)
| where ResourceId in (IdleVMs)
| summarize MonthlyCost = sum(Cost) by ResourceId
| join kind=inner (IdleVMs) on $left.ResourceId == $right._ResourceId
| project ResourceId, AvgCPU, MonthlyCost
| order by MonthlyCost desc
This query ranks idle VMs by their monthly cost, making it easier to prioritize actions that will have the greatest financial impact.
You can replicate this process for databases and storage accounts, adding sections to display low-DTU usage, transaction counts, and associated costs. Workbooks also support time-series charts, which let you visualize idle trends over time. For example, you could plot average CPU usage for a group of VMs over the last 90 days, overlaying key business events to differentiate expected low-activity periods from unnecessary resource usage.
Workbooks can be tailored for different audiences. A "Technical Details" tab might include raw query results for engineers, while an "Executive Summary" tab could highlight high-level metrics, cost estimates, and a "Top 10 Idle Resources by Monthly Waste" table for finance teams. Once completed, these workbooks can be saved, shared, pinned to dashboards, or even set up for automated exports, integrating idle-resource analysis into your broader cost-management strategy.
Comparing Metrics Explorer, Log Analytics, and Workbooks
Azure Monitor offers several tools for analyzing idle resources, each with its own strengths. Here’s a quick comparison:
| Tool | Scope | Complexity | Best Use Cases |
|---|---|---|---|
| Metrics Explorer | Single resource or small groups | Low | Quick checks of performance metrics |
| Log Analytics | Cross-resource, multi-subscription | Medium to High | Query-driven analysis using KQL |
| Workbooks | Organization-wide, interactive | Medium | Reports combining metrics, logs, and cost data |
Fixing Idle Resource Issues to Reduce Costs
Identifying idle resources is just the first step in cutting down your Azure costs. To see real savings, you need to take action - whether that's resizing, scaling down, or removing underutilized assets. It's worth noting that idle or underutilized resources can make up 20–30% of cloud expenses. However, you need to tread carefully to avoid removing critical components, like an essential database or a low-traffic yet important virtual machine (VM). The most effective approach combines three key strategies: adjusting resource sizes to match actual demand, automating the cleanup of truly unused assets, and setting up governance practices to prevent idle resources from piling up. Let’s dive into how you can tackle these inefficiencies.
Right-Sizing and Scaling Down Resources
Once you've set up metrics and alerts, the next step is right-sizing. This involves fine-tuning resource configurations - like VM sizes, database tiers, or App Service Plans - to better align with actual usage. For instance, a VM consistently using less than 20% of its CPU over 30 days is a clear candidate for downsizing. The same principle applies to databases with low activity or App Service Plans handling minimal requests.
Azure Advisor is a great tool for this. It scans your environment and provides recommendations for underutilized resources. For example, it might suggest moving a VM to a smaller SKU, which can add up to noticeable savings when applied across your environment.
For databases, right-sizing could mean switching to a lower-tier SKU or opting for serverless models that scale down - or even pause - during periods of inactivity. Azure SQL Database serverless tiers, for example, pause automatically after a set period of inactivity, charging primarily for storage during downtime. Similarly, App Service Plans can be scaled down by reducing the number of instances or selecting a lower pricing tier. Autoscale rules can also be configured to adjust capacity based on metrics like CPU usage or HTTP queue length, ensuring resources are only used when needed.
Before making any changes, always test in a non-production environment and closely monitor metrics after adjustments.
Automating Idle Resource Cleanup
Manual cleanup might work in the short term, but idle resources tend to pile up again without automation. Common culprits include unattached disks, unused IP addresses, idle load balancers, and orphaned snapshots.
Azure Automation runbooks make it easy to schedule cleanup tasks. For example, a PowerShell runbook can identify unattached disks, check their creation dates or tags for a grace period (e.g., 30 days), and delete those that meet the criteria. A similar process can be used for unused public IP addresses - scanning for IPs not linked to any resource for over 30 days and either deleting them or notifying their owners for review. By requiring tags like "owner" and "expiration date" on all resources, you can ensure that automation scripts only target assets that are no longer needed, minimizing the risk of accidentally deleting critical components.
Logic Apps can also trigger automated workflows based on Azure Monitor alerts. For example, if a VM's CPU usage remains below 5% for 30 consecutive days, an alert can kick off a workflow that notifies the resource owner or even deallocates the VM after a grace period.
To avoid mistakes, include notifications before executing automated cleanups. For instance, send an email to the resource owner several days in advance. Also, log all cleanup actions in a central Log Analytics workspace for auditing and tracking purposes.
Working with AppStream Studio for Modernization
Reducing idle resources isn’t just about cutting costs - it’s also a step toward modernizing your Azure environment. By addressing these inefficiencies, you’re setting the stage for more sustainable operations. Automated monitoring plays a big role here, and this is where AppStream Studio can help. They specialize in helping mid-market organizations monitor idle resources, automate cleanup workflows, and integrate cost insights into modernization strategies.
AppStream Studio offers services like Azure Optimization and Cloud Spend Optimization to help you consolidate infrastructure and reduce costs. Their engineering teams work with you to analyze usage patterns, create custom dashboards in Azure Monitor, and deploy automation runbooks tailored to your policies. They aim to deliver measurable results in weeks, not months.
Beyond basic cleanup scripts, AppStream Studio can implement advanced automation workflows. Using Azure Durable Functions and their open-source Azure Durable Patterns library, they can create stateful pipelines to coordinate VM shutdowns across multiple resource groups, validate dependencies before deletion, and even roll back changes if needed.
Conclusion
Managing idle resources with Azure Monitor is a continuous effort that helps keep your Azure environment efficient and cost-effective. The process begins by identifying underutilized resources - like virtual machines, databases, and storage accounts - using metrics, logs, and KQL queries. From there, you can set up alerts and dashboards to monitor these resources regularly. The final step involves taking action, whether by right-sizing, scaling down, or deallocating resources that aren't adding value. Incorporating these steps into your governance and cost management routines ensures idle resource management becomes a natural part of your cloud operations.
The financial impact of idle resources can be substantial. Left unchecked, these resources can inflate monthly costs. Even small improvements in utilization across multiple subscriptions can lead to noticeable annual savings. Treating idle resource monitoring as a standard practice in your financial operations (FinOps) helps you address inefficiencies before they grow into larger issues.
Consistent monitoring is key to catching cost regressions and keeping resources optimized. As teams deploy new workloads, experiment with features, or retire outdated systems, Azure Monitor’s metrics, alerts, dashboards, and workbooks allow you to identify idle resources, prevent unnecessary costs, and maintain efficient resource utilization.
Azure Monitor offers a suite of tools that work together for a comprehensive strategy. Metrics Explorer provides quick, visual checks and helps set up threshold-based alerts. Log Analytics with KQL supports deeper investigations across resources, while Workbooks offer shareable, visual reports that combine metrics and logs for actionable insights.
Once you've identified idle resource patterns, automation can simplify responses. Use autoscale rules, runbooks, or policies to deallocate underused resources. Start with low-risk automations, like tagging resources or notifying owners, before moving to more impactful actions such as automatic shutdowns or deletions. This phased approach ensures changes are safe and effective in production environments.
Integrating technical monitoring with governance practices ensures accountability. Assign clear ownership of resource costs and utilization by mapping resource groups to specific applications or business units. Use Azure tags or management groups to align idle-resource reporting with your internal chargeback or showback models. During governance meetings, reviewing idle-resource reports ensures insights from Azure Monitor drive timely action instead of piling up as unresolved alerts.
For mid-sized organizations, partnering with companies like AppStream Studio can enhance these efforts. Their Infrastructure Optimization services, including Azure and Cloud Spend Optimization, focus on consolidating infrastructure and reducing costs. By helping teams refactor workloads, integrate cost data with business insights, and deploy AI to prioritize remediation, they provide tailored solutions for industries like financial services and healthcare, where security and compliance are critical.
To get started, review Azure Monitor configurations for a single subscription. Build a simple idle-resource dashboard and set up alerts for low CPU usage or transaction metrics. These small steps can deliver quick wins and build momentum for larger automation and governance initiatives.
Adopt a cautious approach with conservative thresholds and phased pilots to validate changes without risking availability. Mature cloud practices prioritize both optimization and reliability, ensuring cost savings don’t come at the expense of application performance or user experience.
FAQs
How can I identify truly idle Azure resources versus those that are overprovisioned for specific needs?
To figure out which Azure resources are idle or overprovisioned, you can rely on Azure Monitor to analyze usage patterns and performance metrics. Begin by enabling monitoring for your resources and reviewing critical metrics like CPU usage, memory usage, and network activity over a period of time. By comparing these metrics with your actual workload demands, you can pinpoint resources that are underutilized or sitting idle.
For smarter cost management, set up alerts to flag extended periods of low usage. Additionally, take advantage of tools like Azure Advisor, which offers built-in recommendations to fine-tune your resource allocation. This strategy not only helps cut down unnecessary costs but also ensures your infrastructure stays in sync with your business goals.
How can I automate the cleanup of idle resources in Azure to avoid unnecessary costs?
Reducing unnecessary expenses in Azure becomes much easier when you automate the cleanup of idle resources. Here's how you can streamline the process:
Start by using Azure Resource Manager policies to identify and tag resources that show low usage based on their metrics. Once tagged, you can rely on Azure Automation to create runbooks that regularly check these resources. Depending on your setup, these runbooks can either deallocate or remove idle resources automatically.
To take it a step further, make use of Azure Advisor for recommendations on underused resources. Pair this with Azure Monitor to set up alerts that track idle usage patterns. By integrating these tools, you can efficiently manage idle resources and cut down on manual work, all while keeping costs in check.
How can Azure Monitor help track idle resources to optimize cloud costs and improve resource management?
Azure Monitor helps you spot and analyze idle or underused resources in your cloud setup. By keeping an eye on usage patterns and performance metrics, it highlights areas where resources might be going to waste or not being utilized to their full potential. This lets you make adjustments or scale down resources, cutting down on unnecessary expenses while boosting efficiency.
On top of that, Azure Monitor offers actionable recommendations and clear visualizations to guide your decisions about resource allocation. With this improved visibility into resource usage, you can fine-tune your cloud infrastructure to balance performance and cost more effectively.